Well, the Fed finally paused, which judging by investor polls seemed to have been well-communicated. Bank treasurers informally polled by this newsletter could not have been surprised by the Fed’s statement that it was still weighing how much more to tighten rates in its fight against inflation, and not surprised by its “hawkish” pause. Yet its willingness to continue Quantitative Tightening (QT) while the bond market is on the verge of a massive Treasury debt calendar between now and the end of this year might be more troubling to them, as discussed in this month’s edition of The Bank Treasury Newsletter.
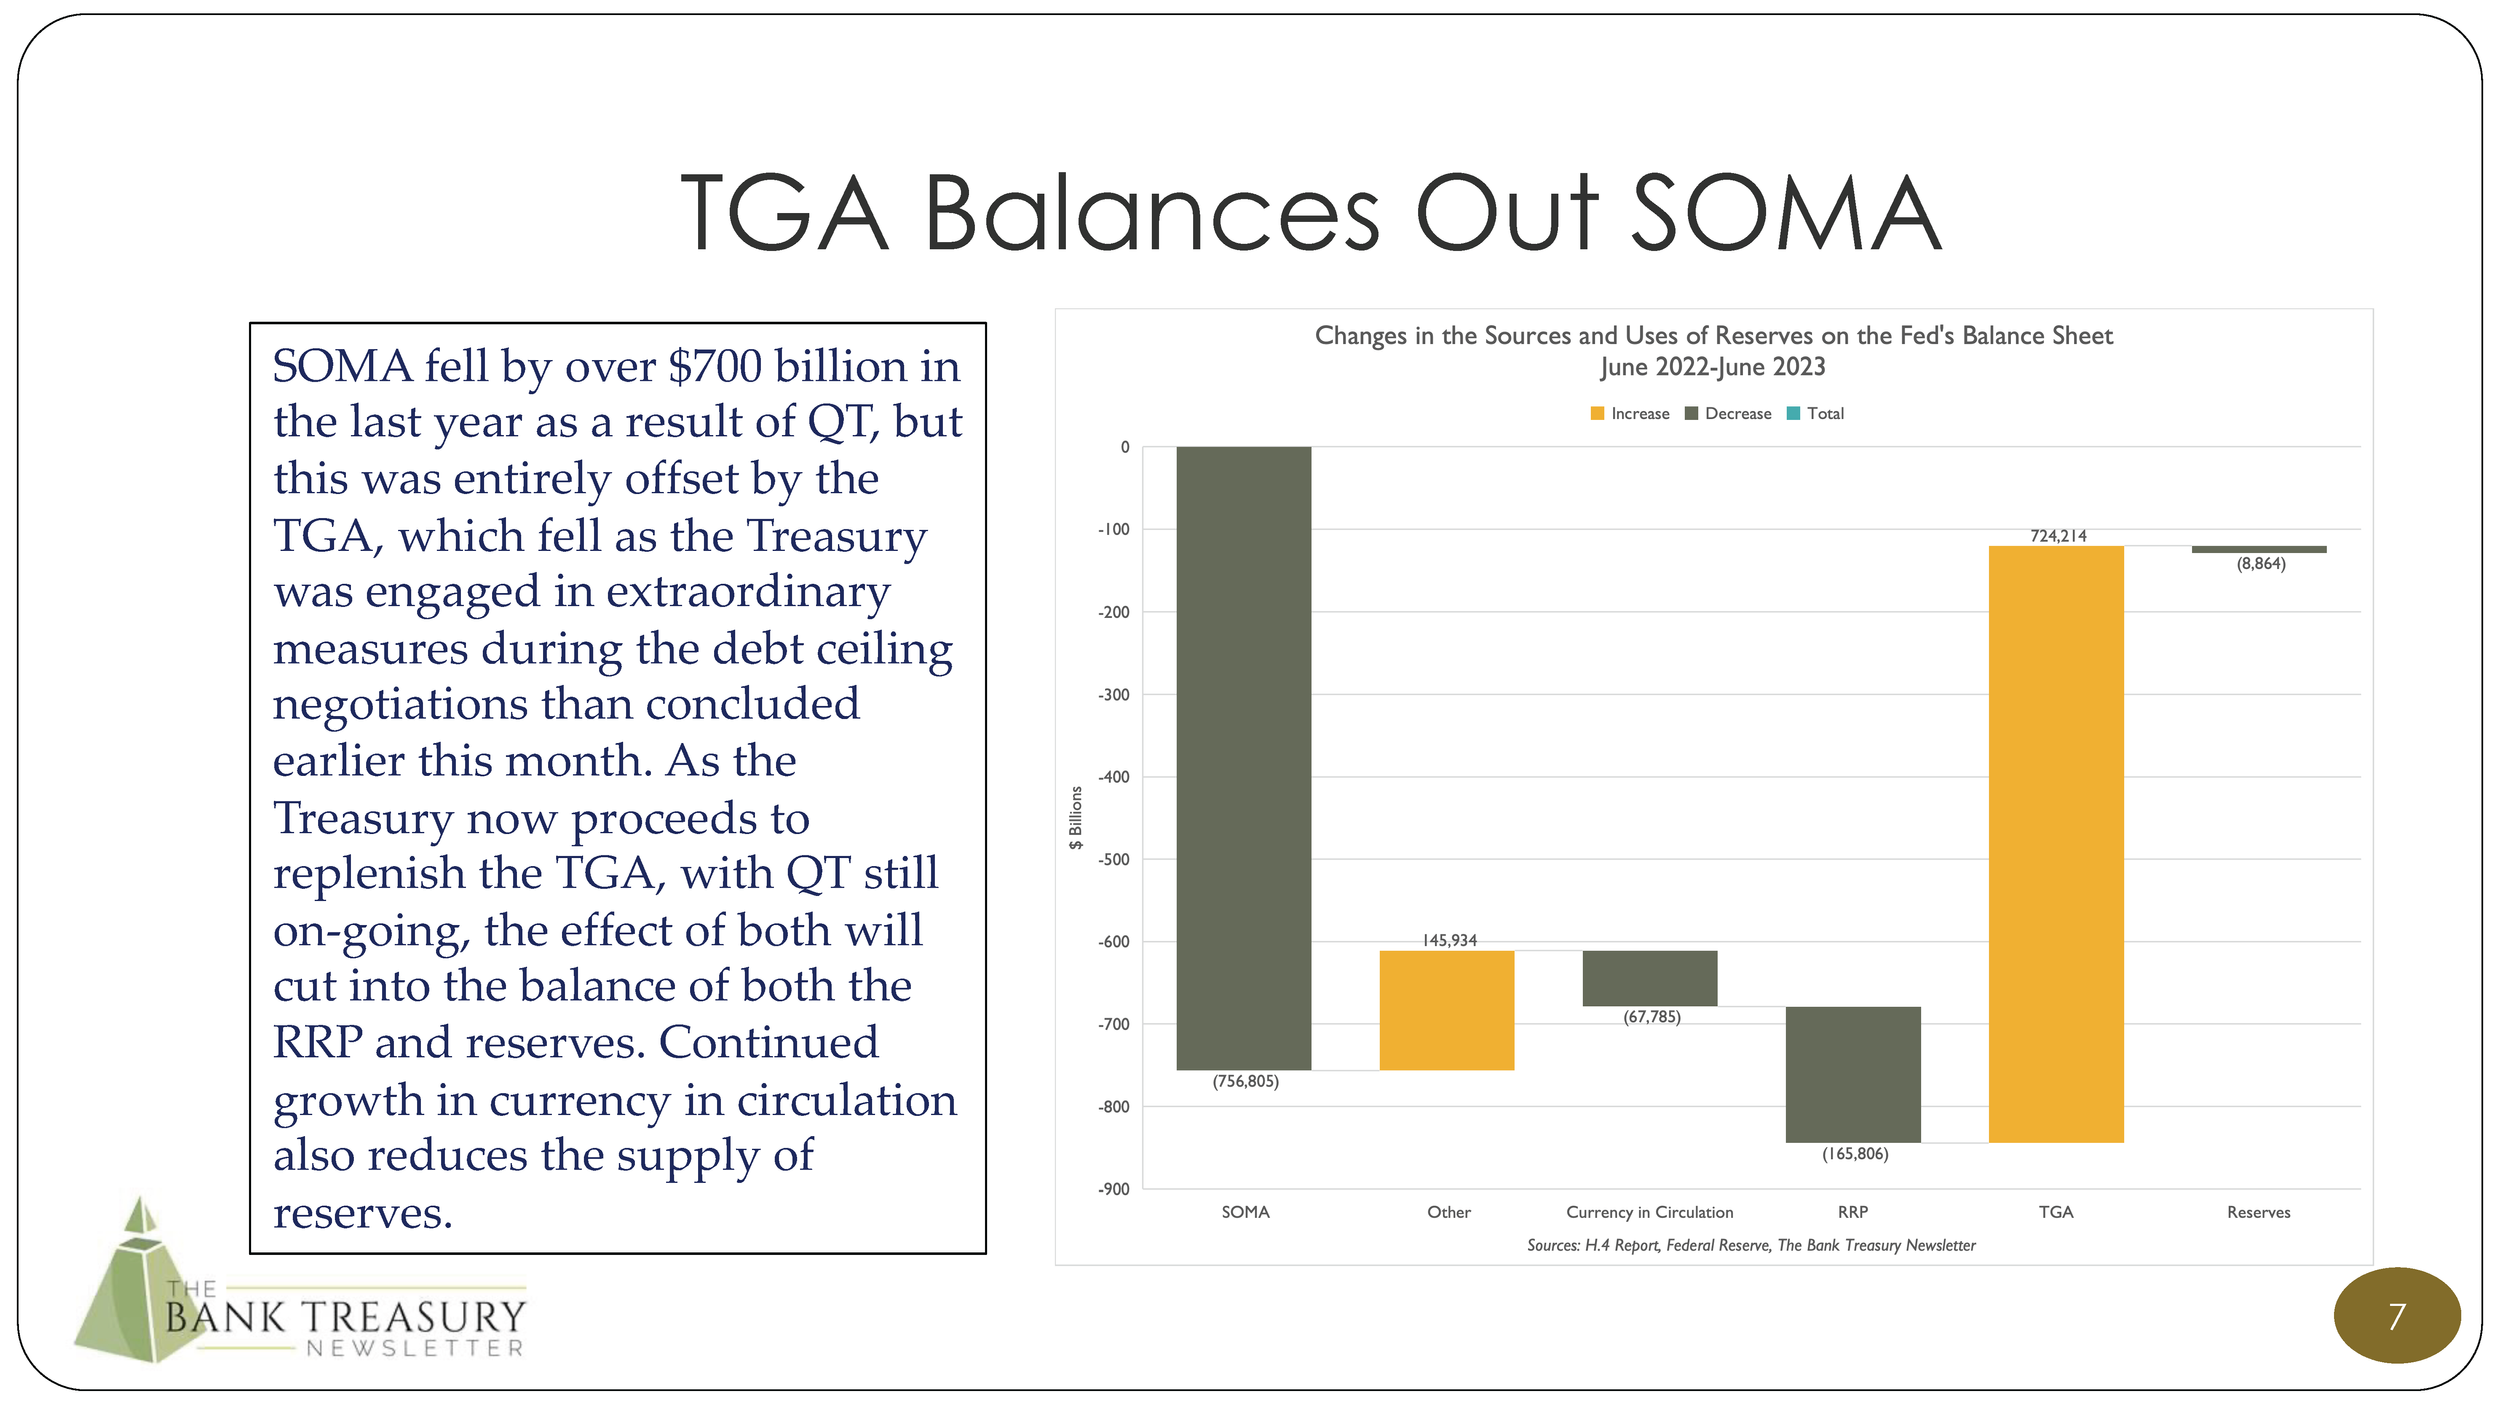
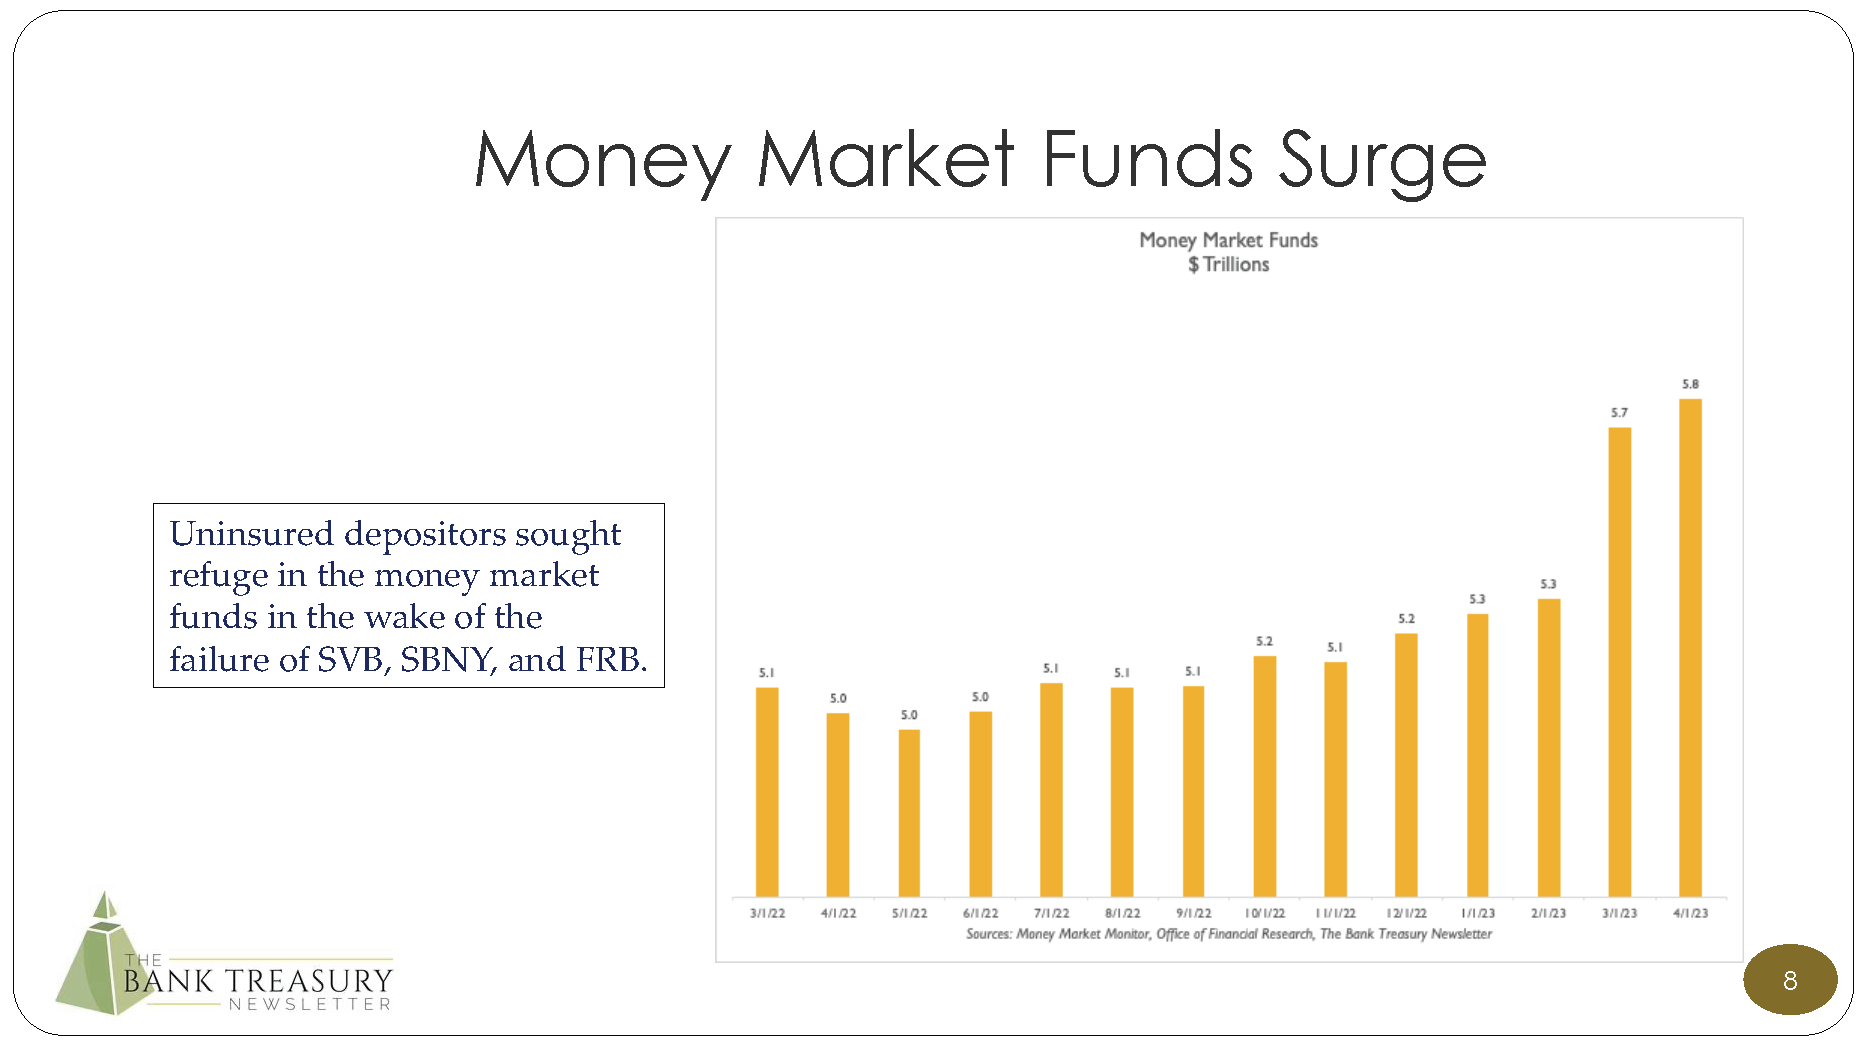
The Fed reduced its securities holdings by over $800 billion since it began QT last year, but this was offset in its entirety because the Treasury General Account (TGA) fell by an equal sum during the debt ceiling drama and the Reverse Repo Facility (RRP) offset the rest. Now, as the Treasury seeks to rebuild the TGA, and the Fed intends to continue with QT, the question bank treasurers are trying to wrestle with is what this means for bank deposits. Also, what will this mean for money market funds, which grew to $5.8 trillion by the end of April 2023, up $0.7 trillion since the Fed began to raise rates in March 2022.
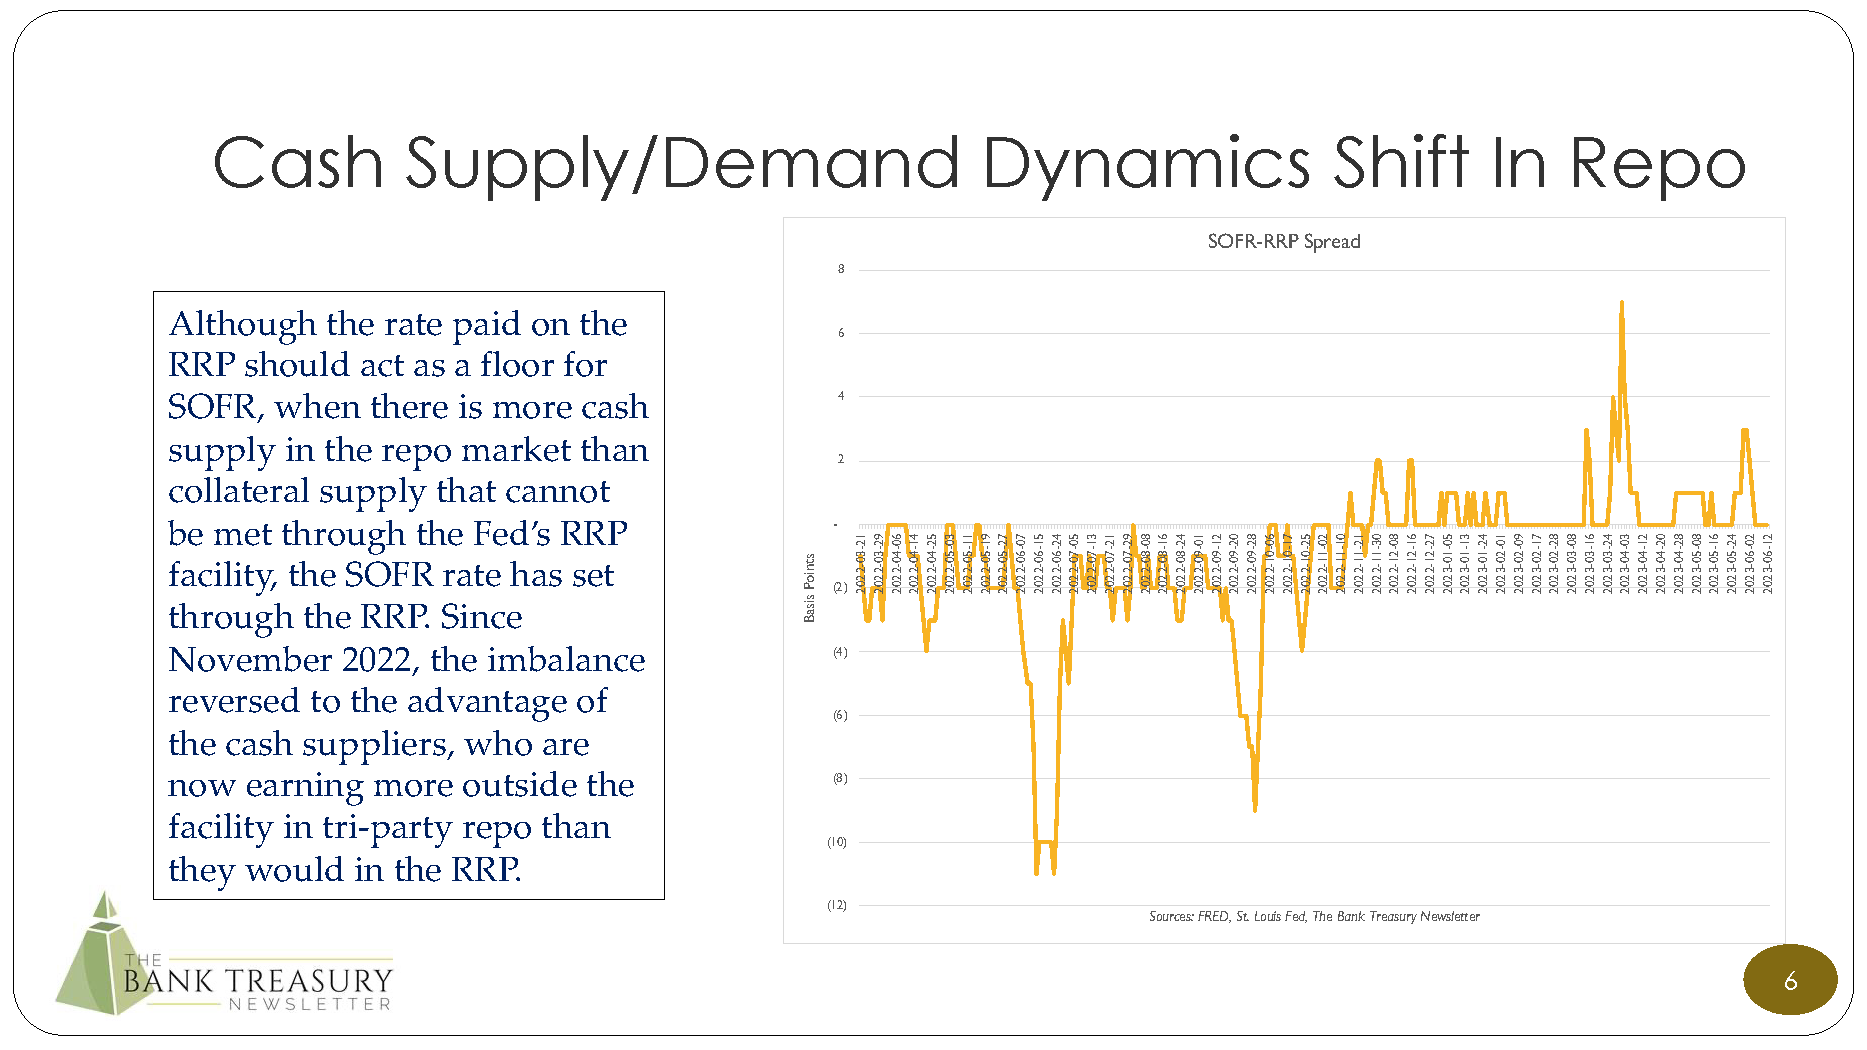
The money funds play a crucial role in the Treasury repo market which is the basis for the Secured Overnight Financing Rate (SOFR. Going back in time to the disruption in that market on September 16 and 17, 2019, the newsletter discusses why the Fed could be soon reaching a terminal point for QT, even with reserves at $3.3 trillion and the RRP standing at $2.2 trillion.
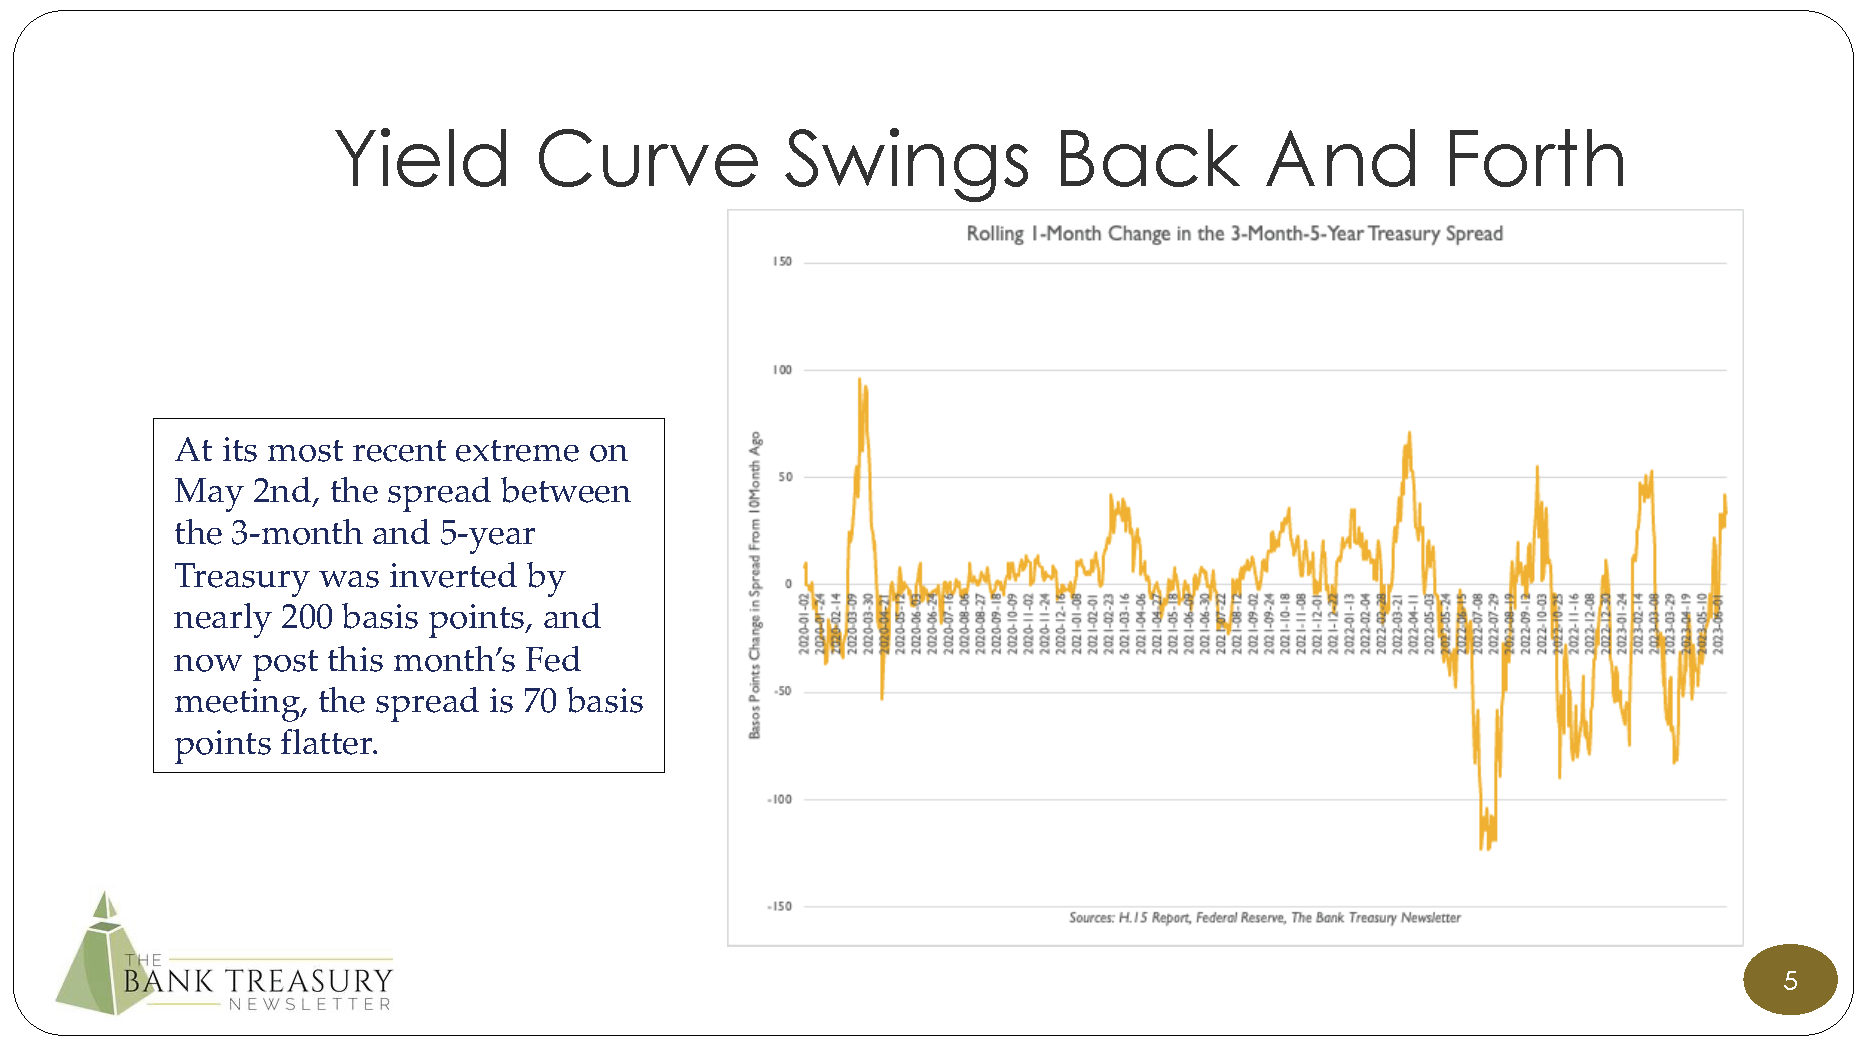
Beyond the worry that the Fed may overtighten short-term liquidity and what this might mean for the financial markets in which bank treasurers try to make money in every day, the newsletter discusses how the inverted yield curve is a major headwind for bank treasurers to price loans and deposits competitively. Rounding out their list of worries, the newsletter includes a short take on the Basel 3 endgame that could be coming into view in the near term, and what other developments in the regulatory response to the failure of Silicon Valley Bank, Signature Bank, and First Republic will mean for asset-liability management.
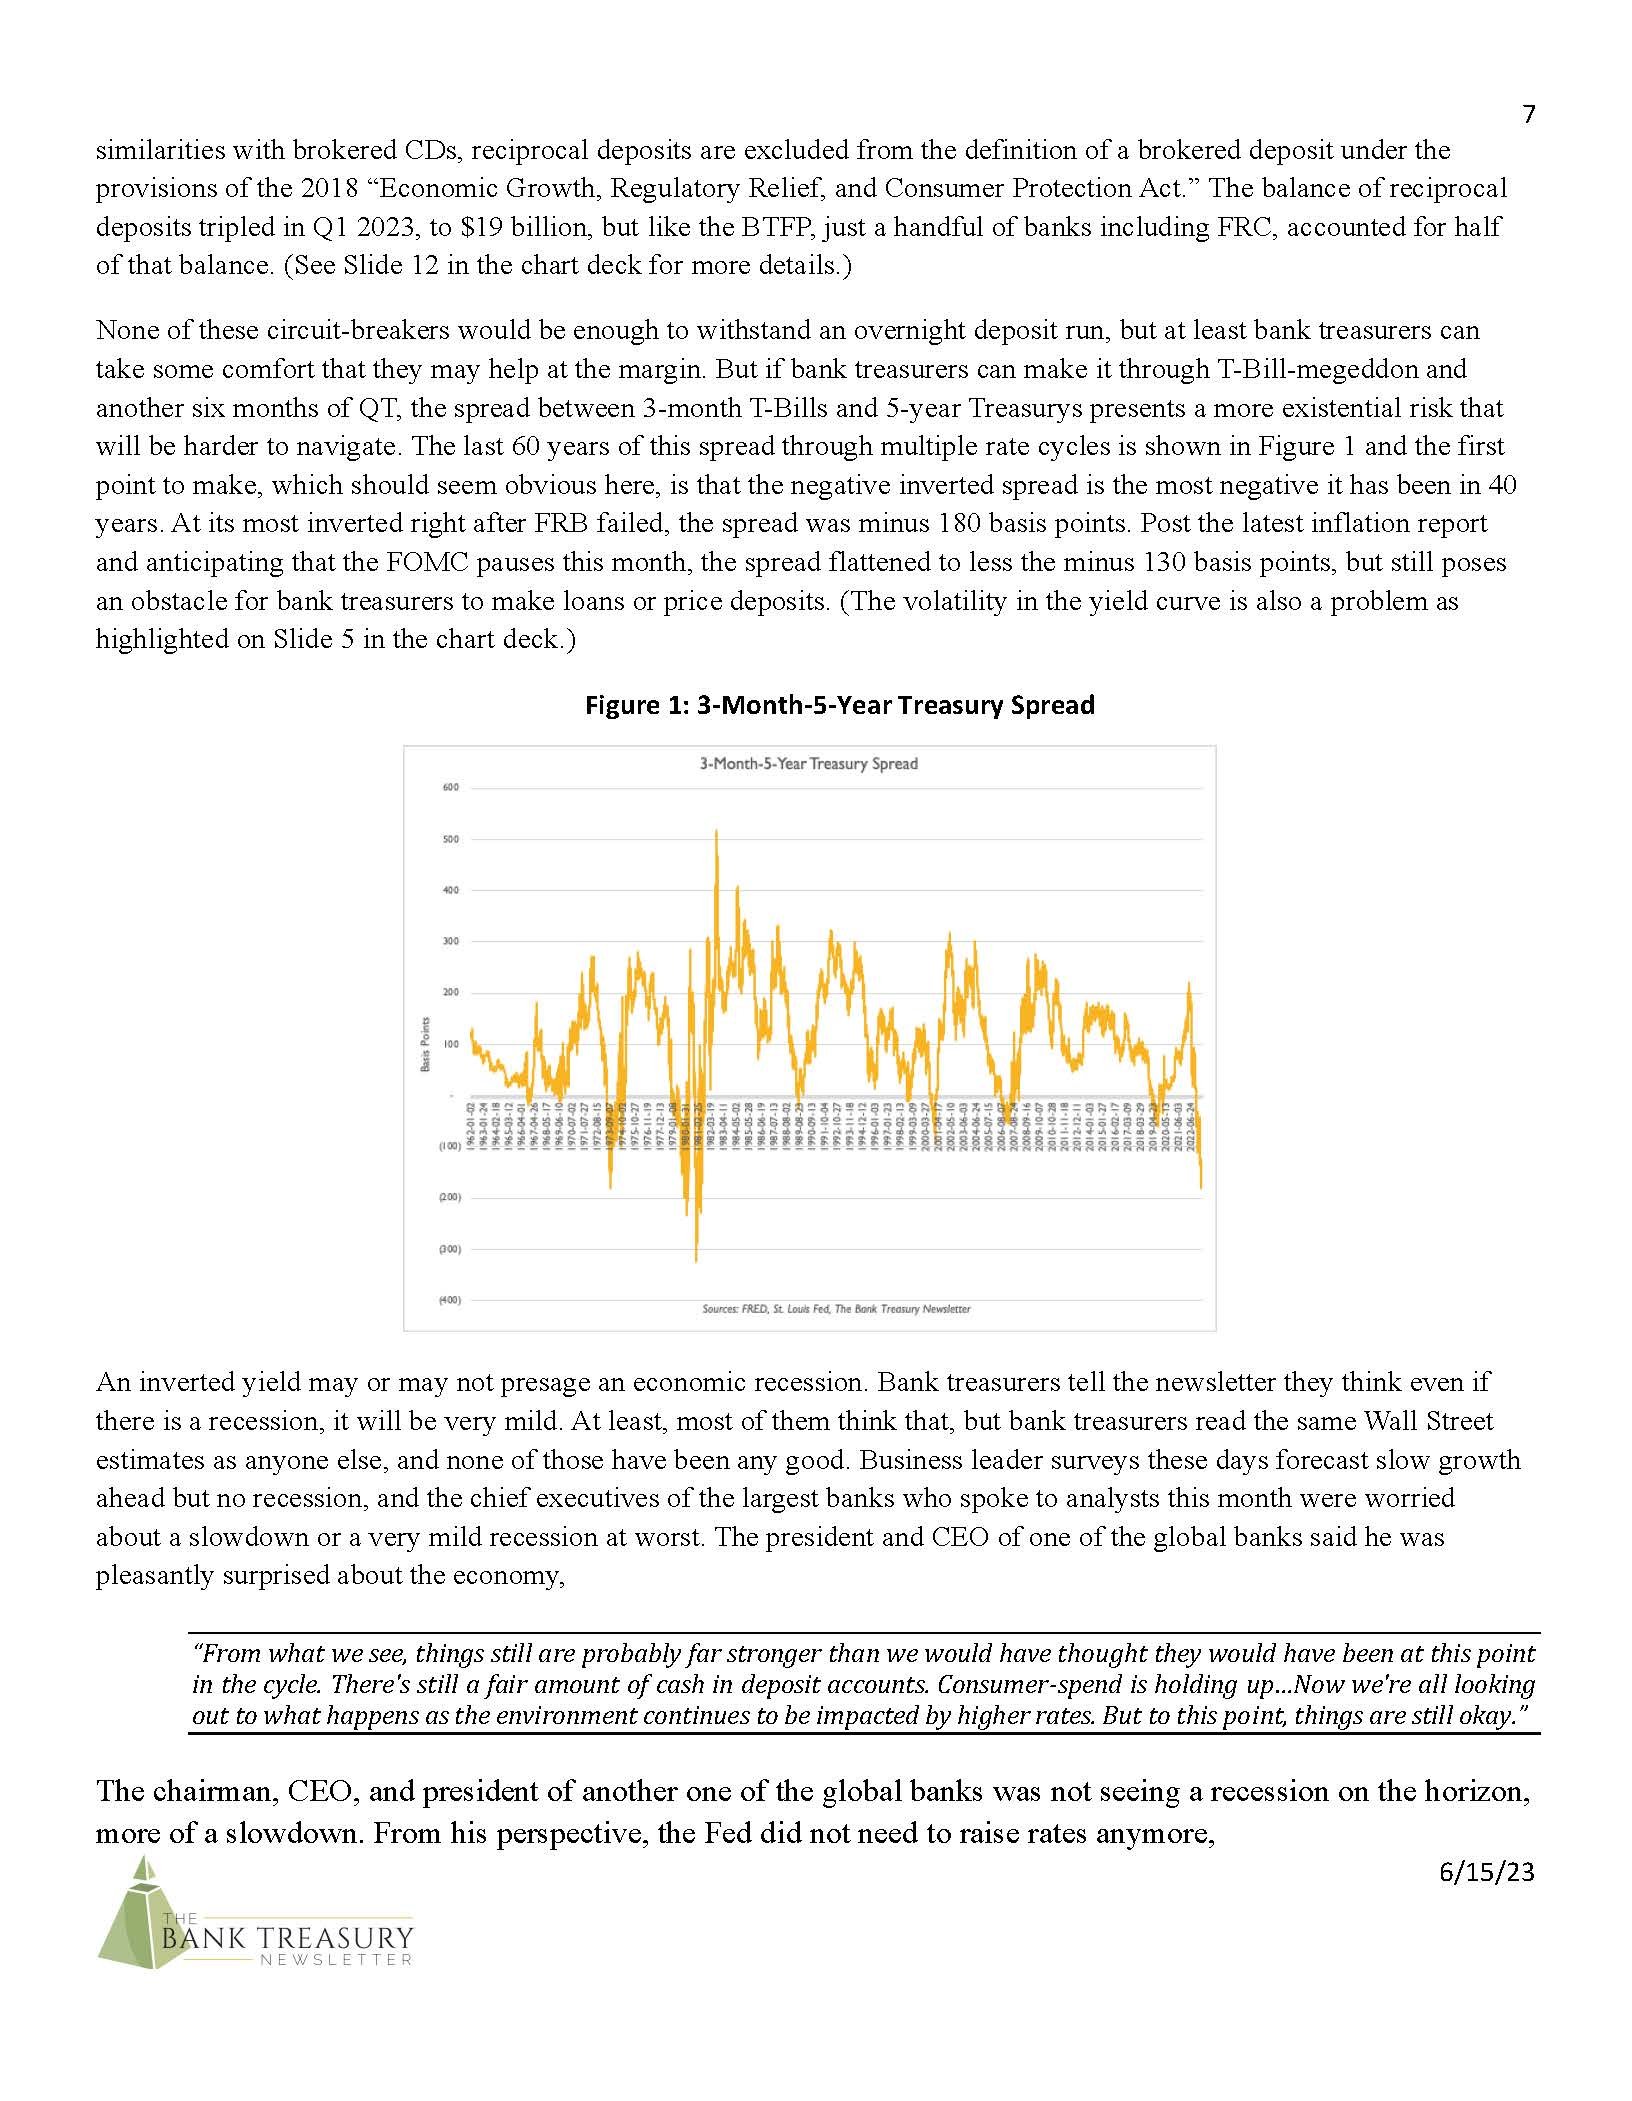
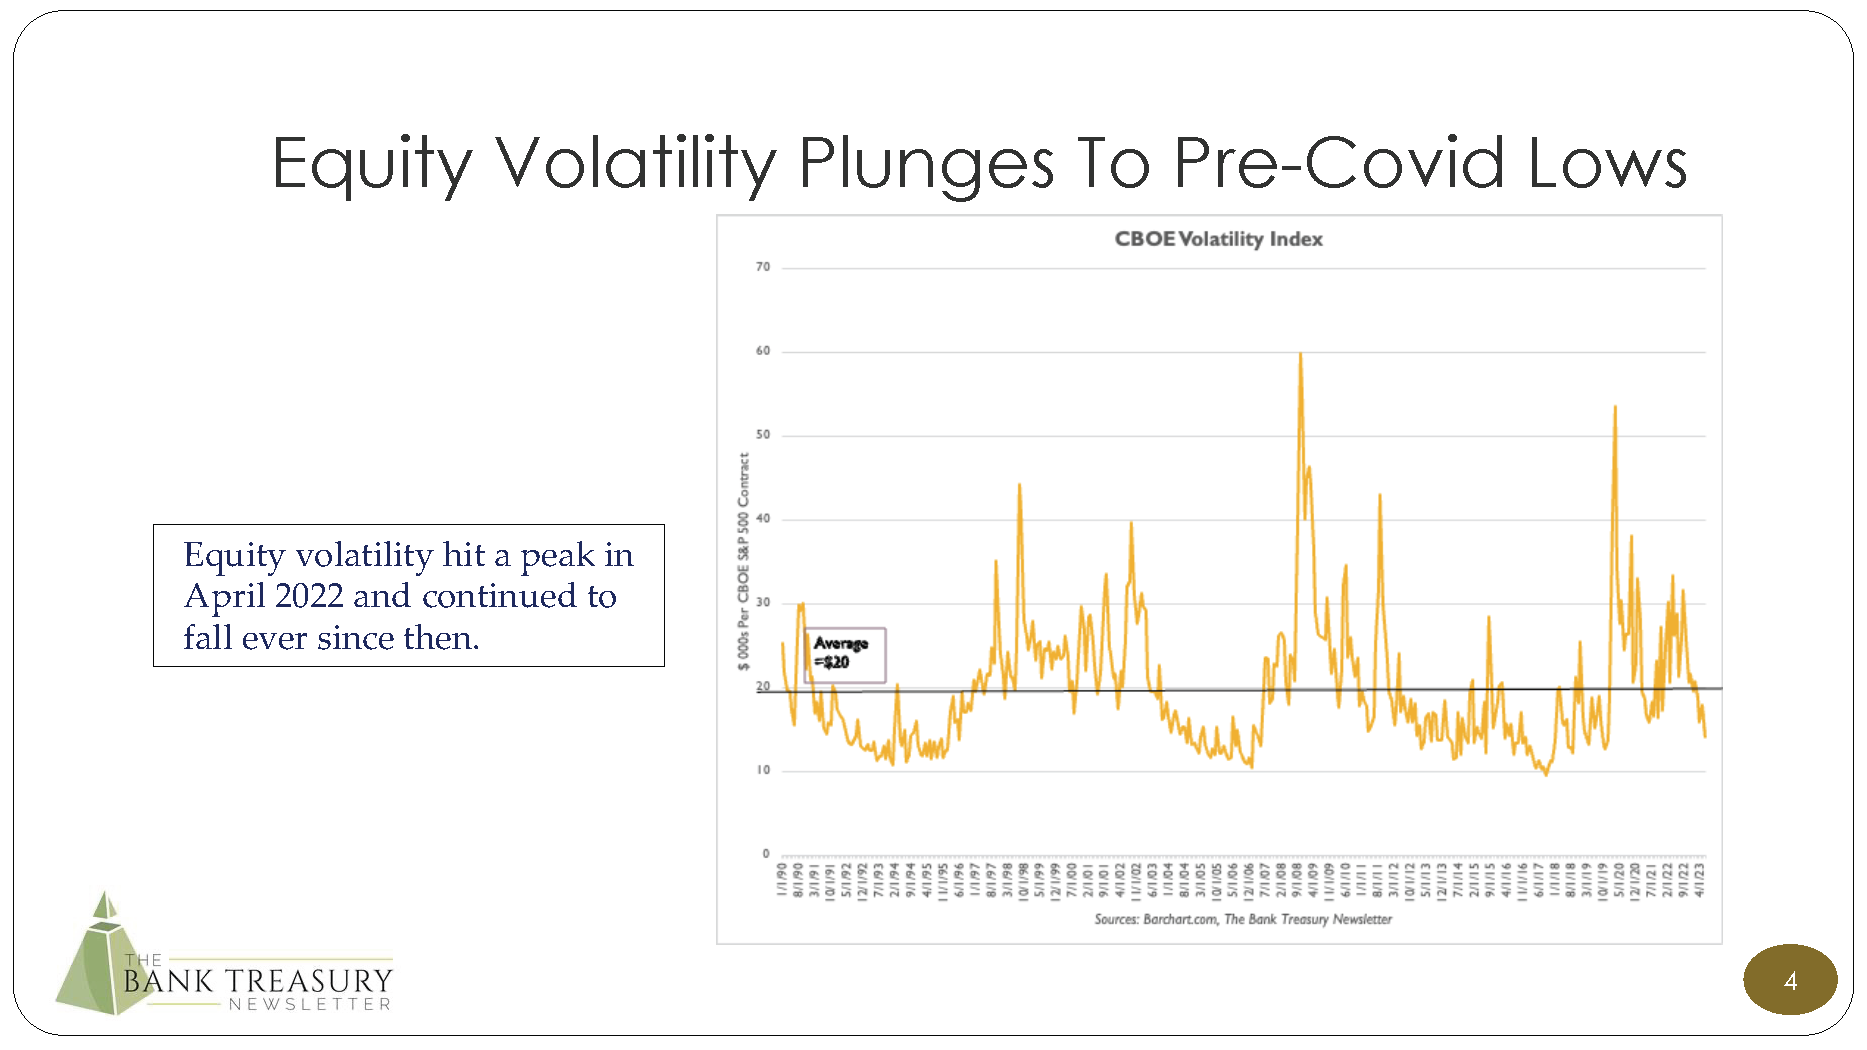
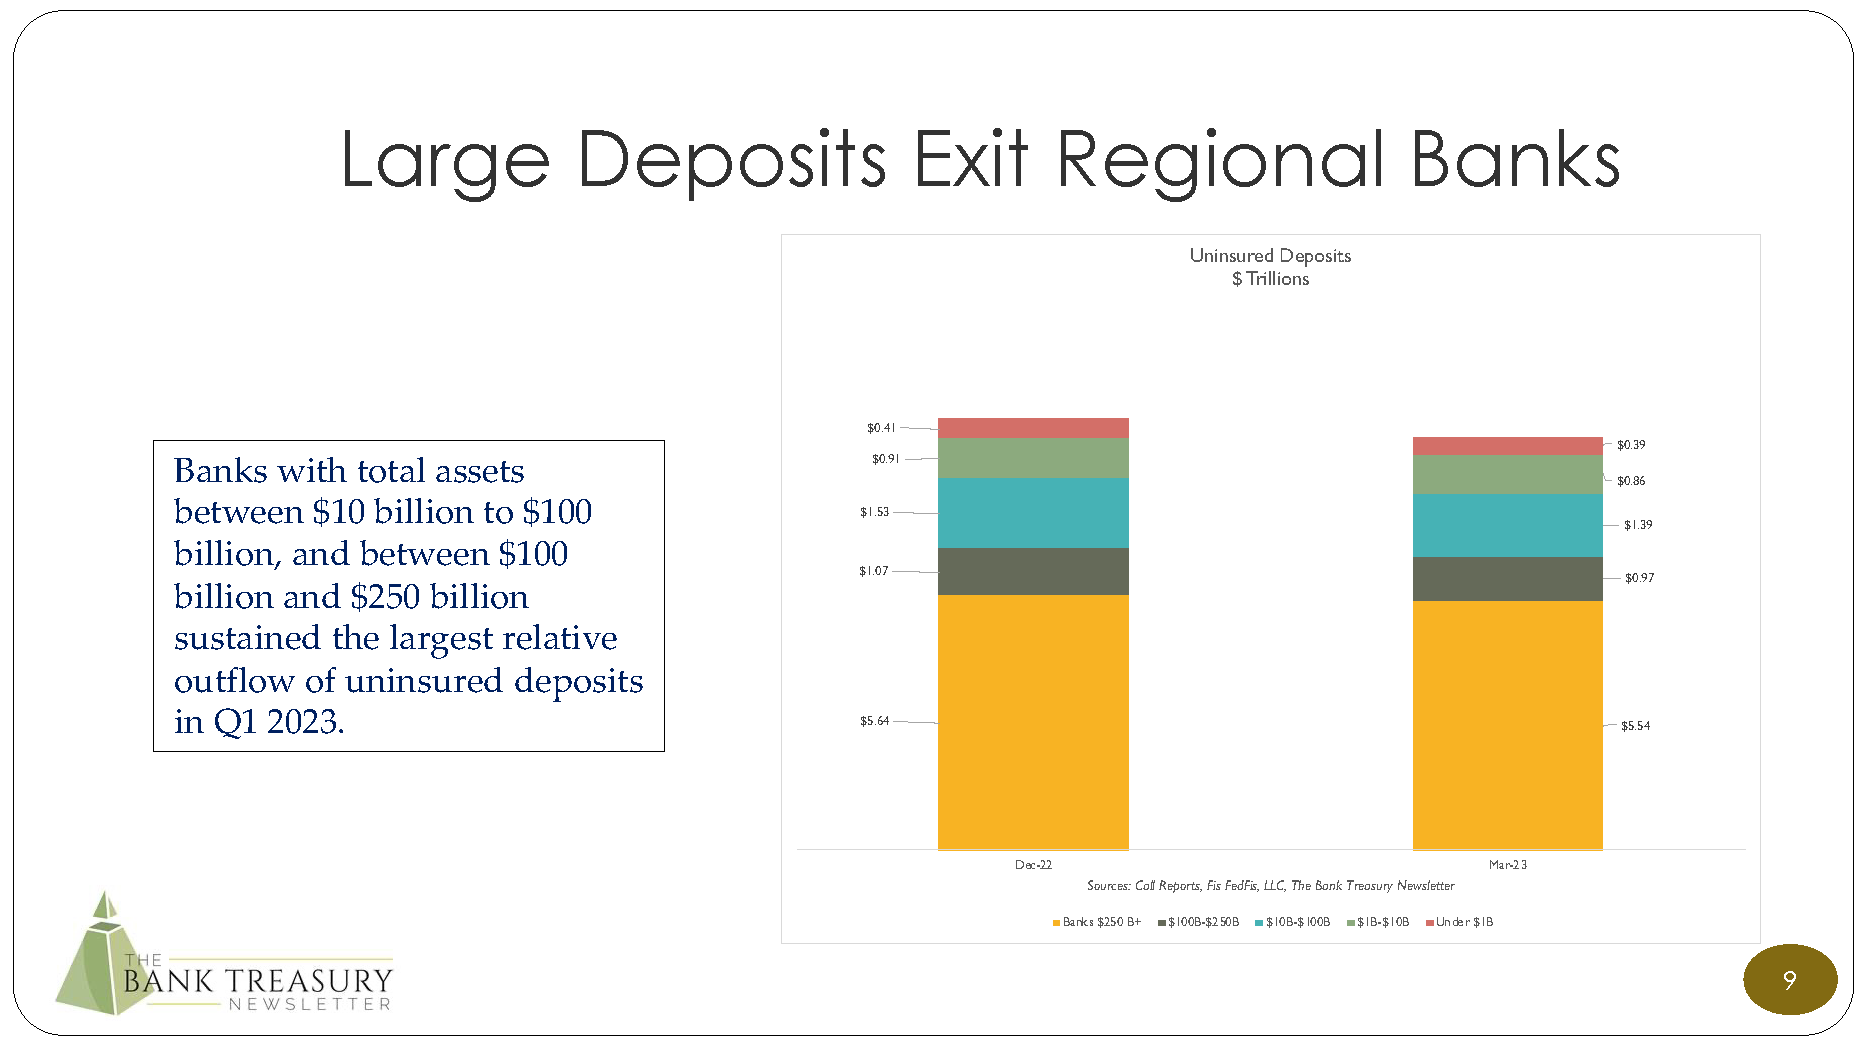
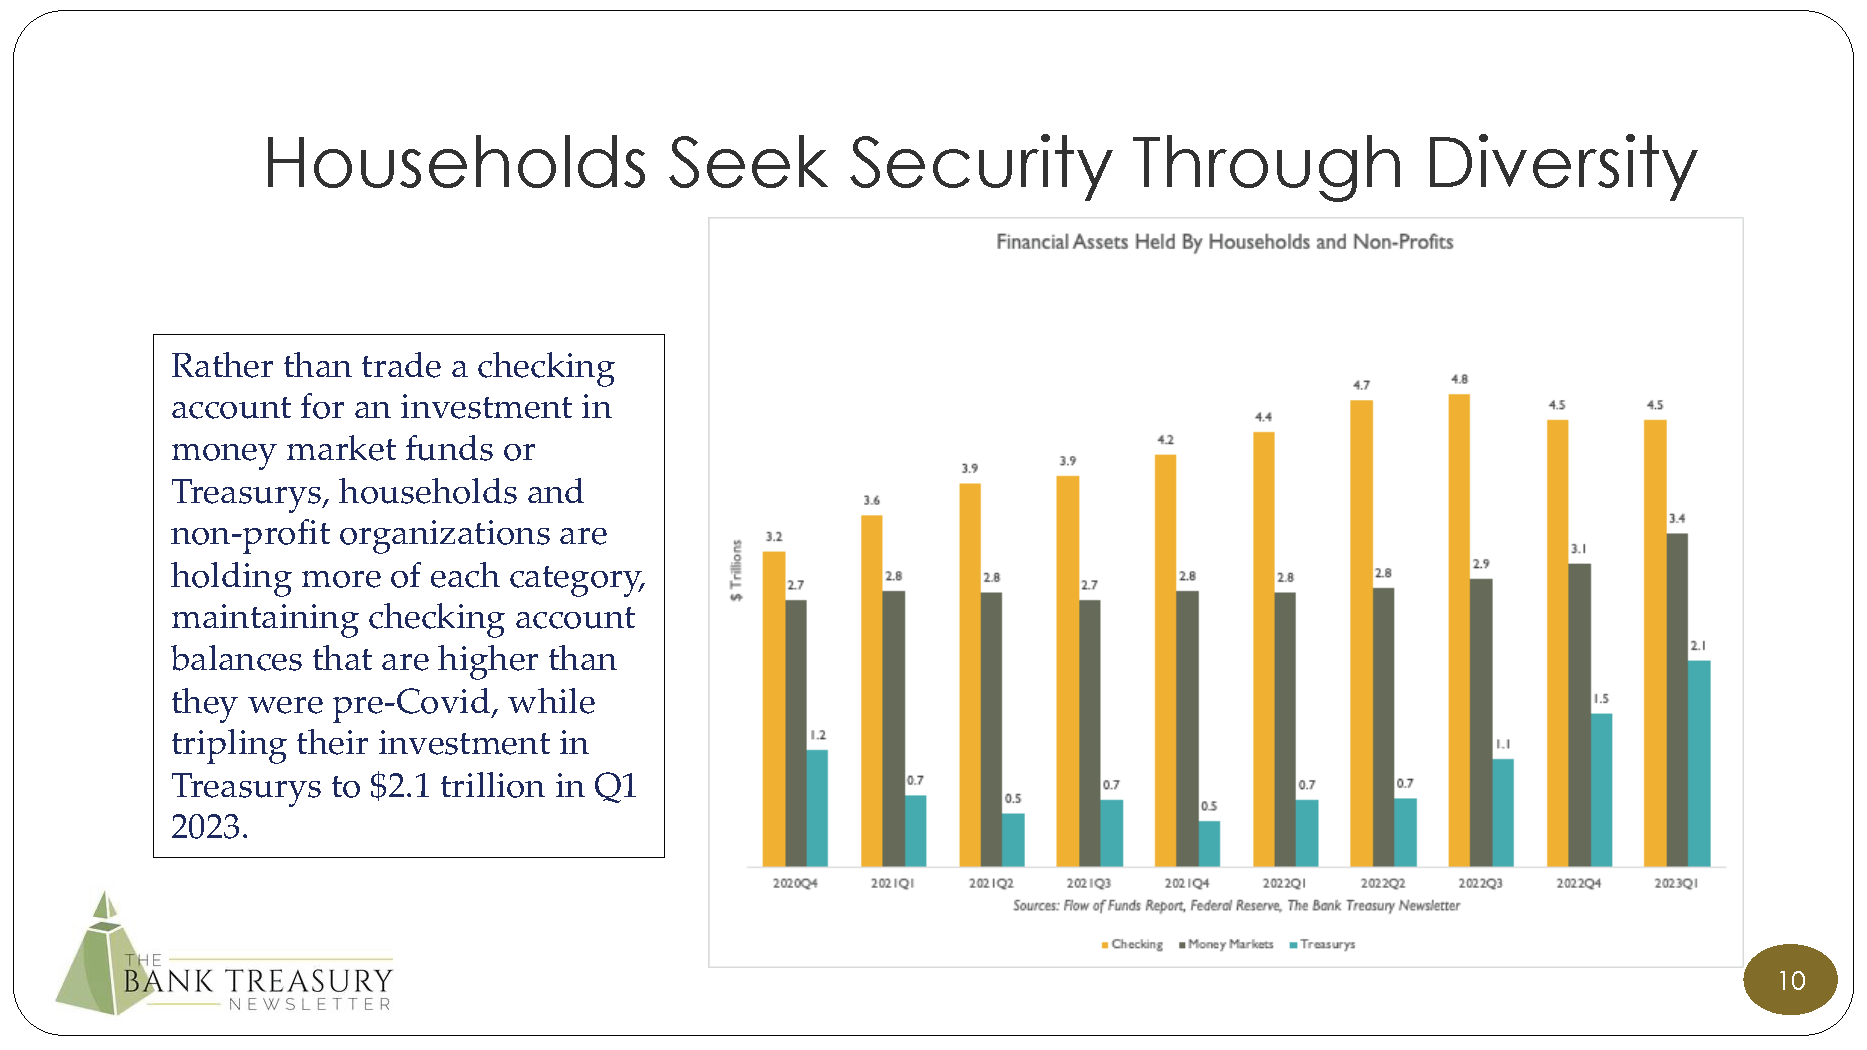
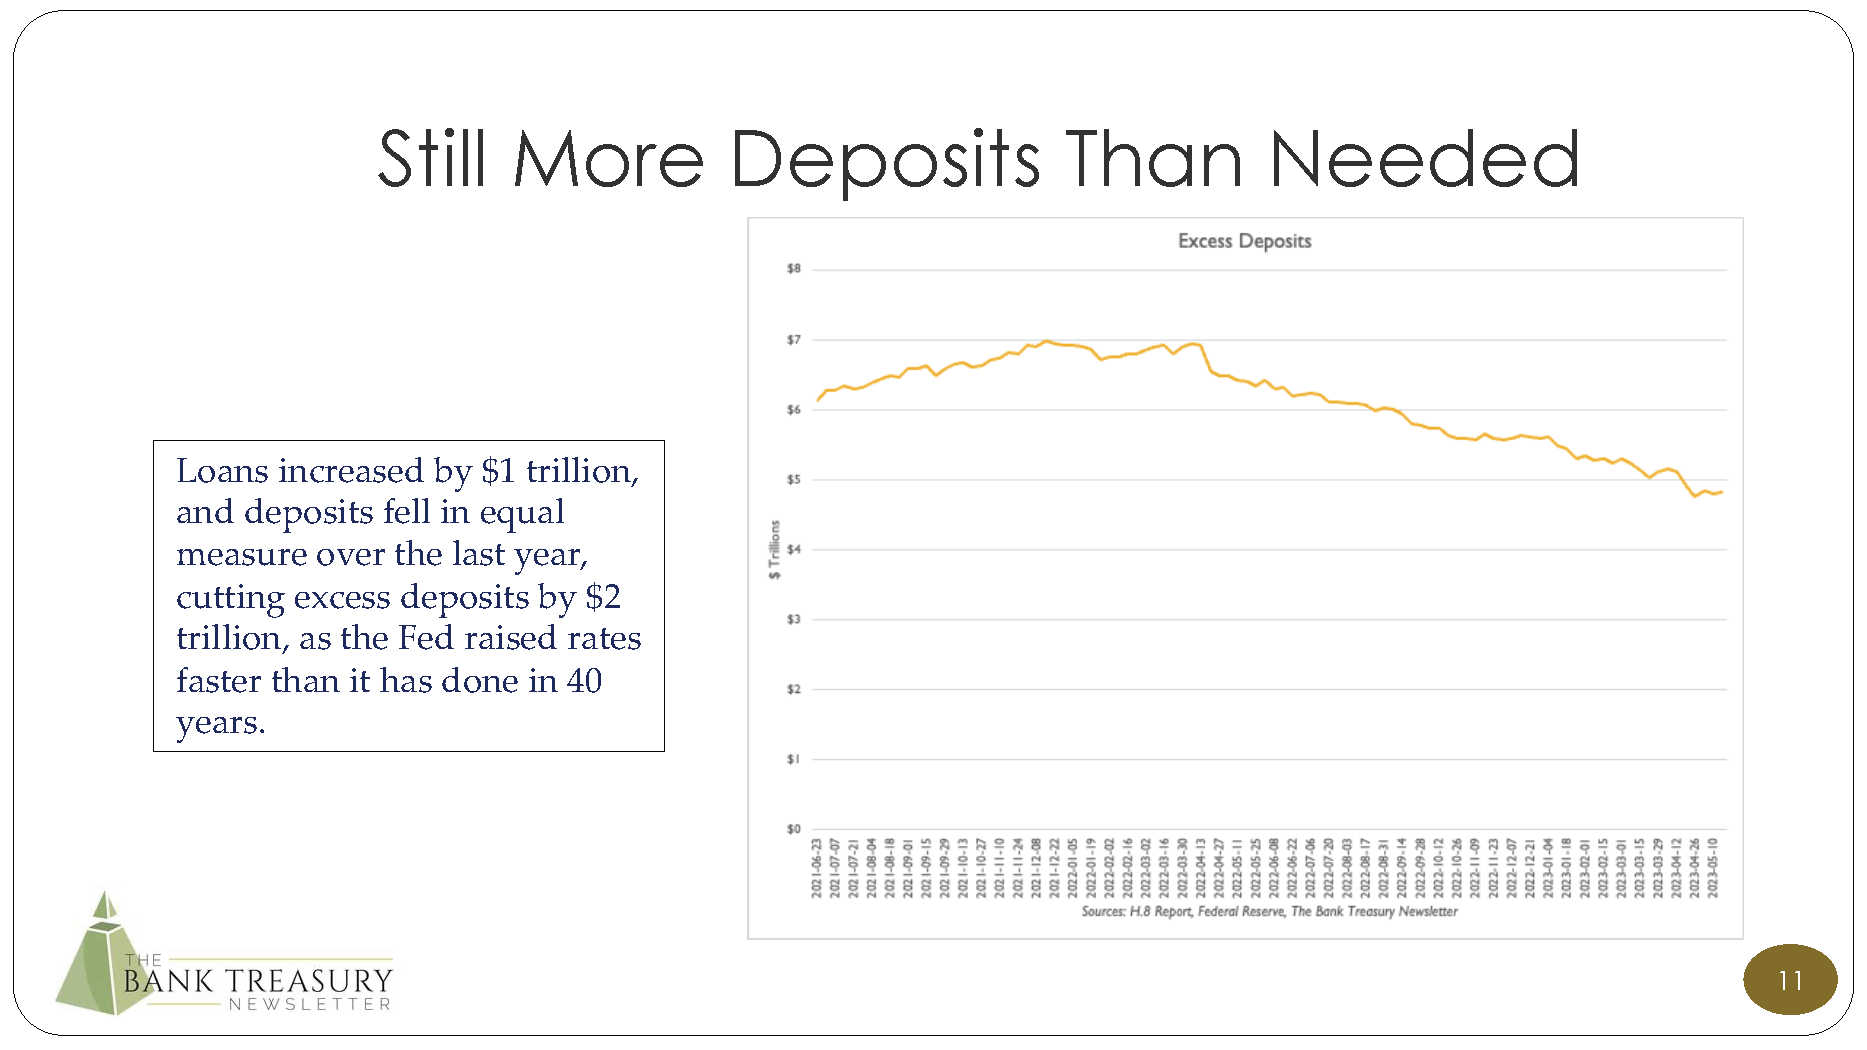
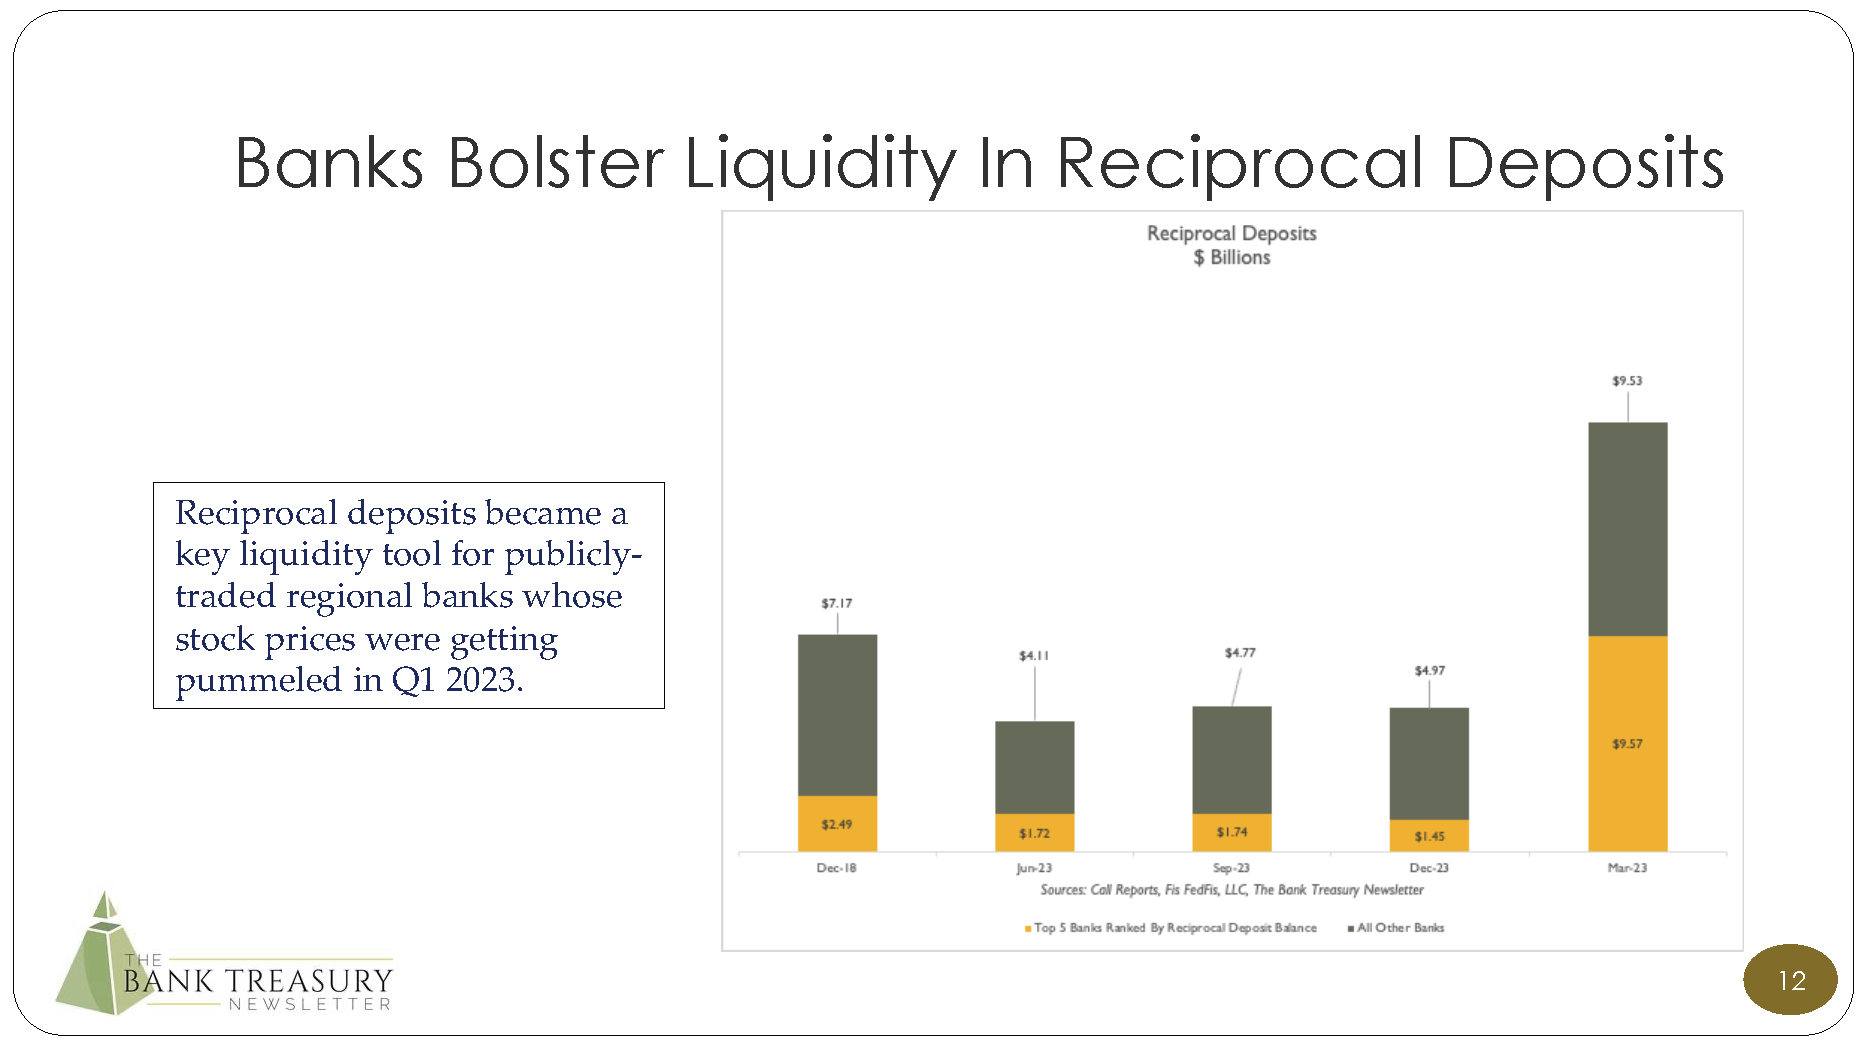
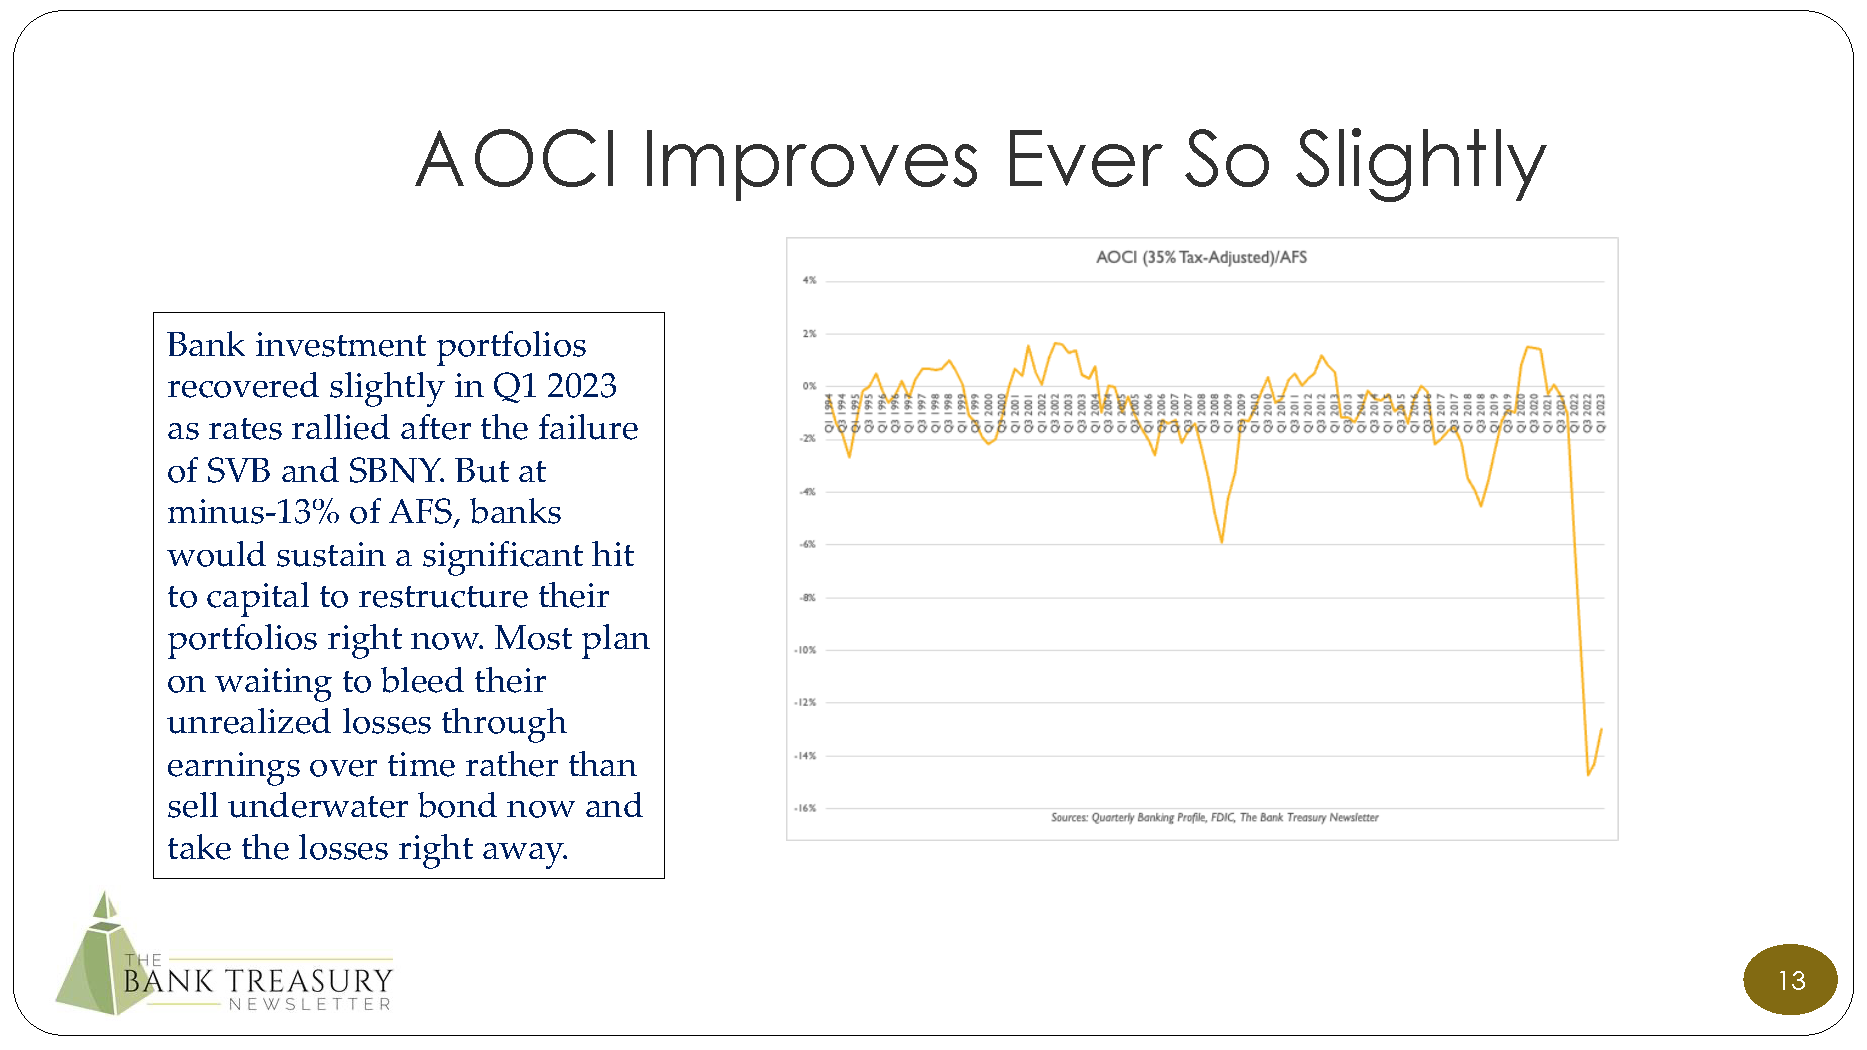
This month’s chart deck begins by comparing the sharply lower volatility in the equity markets over the last year, with the wild, swinging yield curve, especially the spread between the 3-month and 5-year Treasury that has steepened and flattened multiple times since the on-set of Covid, and how the spread between the Fed’s RRP and SOFR shows how short-term money market liquidity appears to be constrained (Slide 6). The next set of slides look at recent trends in deposits, including uninsured deposits, and how some of the banks whose stocks were being pummeled in the equity markets in March, used reciprocal deposits as one tool among several to weather the liquidity storm that followed. The last slide in the deck highlights how the rally in rates since the bank failures did very little to reduce the negative drag on bank liquidity thanks to their deeply unwater bond portfolios.