BANK TREASURERS SEE THROUGH THE ACCOUNTING
Listen to an audio version of this newsletter on Apple Podcasts, Spotify, Amazon Music, Audible, or your favorite podcast platform.
The Bank Term Funding Facility (BTFP) program, which the Fed launched to calm markets and help provide liquidity to the banking system when Silicon Valley Bank (SVB) and Signature Bank failed last March, will terminate as originally scheduled on March 11th. As of January 25th, the rate for its 1-year term loans, which previously was set at 10 basis points over the Overnight Index Swap rate, would increase to no less than the rate paid for reserve deposits. The balance of the facility, which is reported on the asset side of the Fed’s balance sheet, increased by $30 billion since the start of the year, to $165 billion. The Fed reported this month that it earned $4.7 billion in interest income from the loans made under the facility. The increase in the BTFP partially offset a $110 billion decrease in the Fed’s System Open Market Account (SOMA), to $7.1 trillion, under Quantitative Tightening (QT).
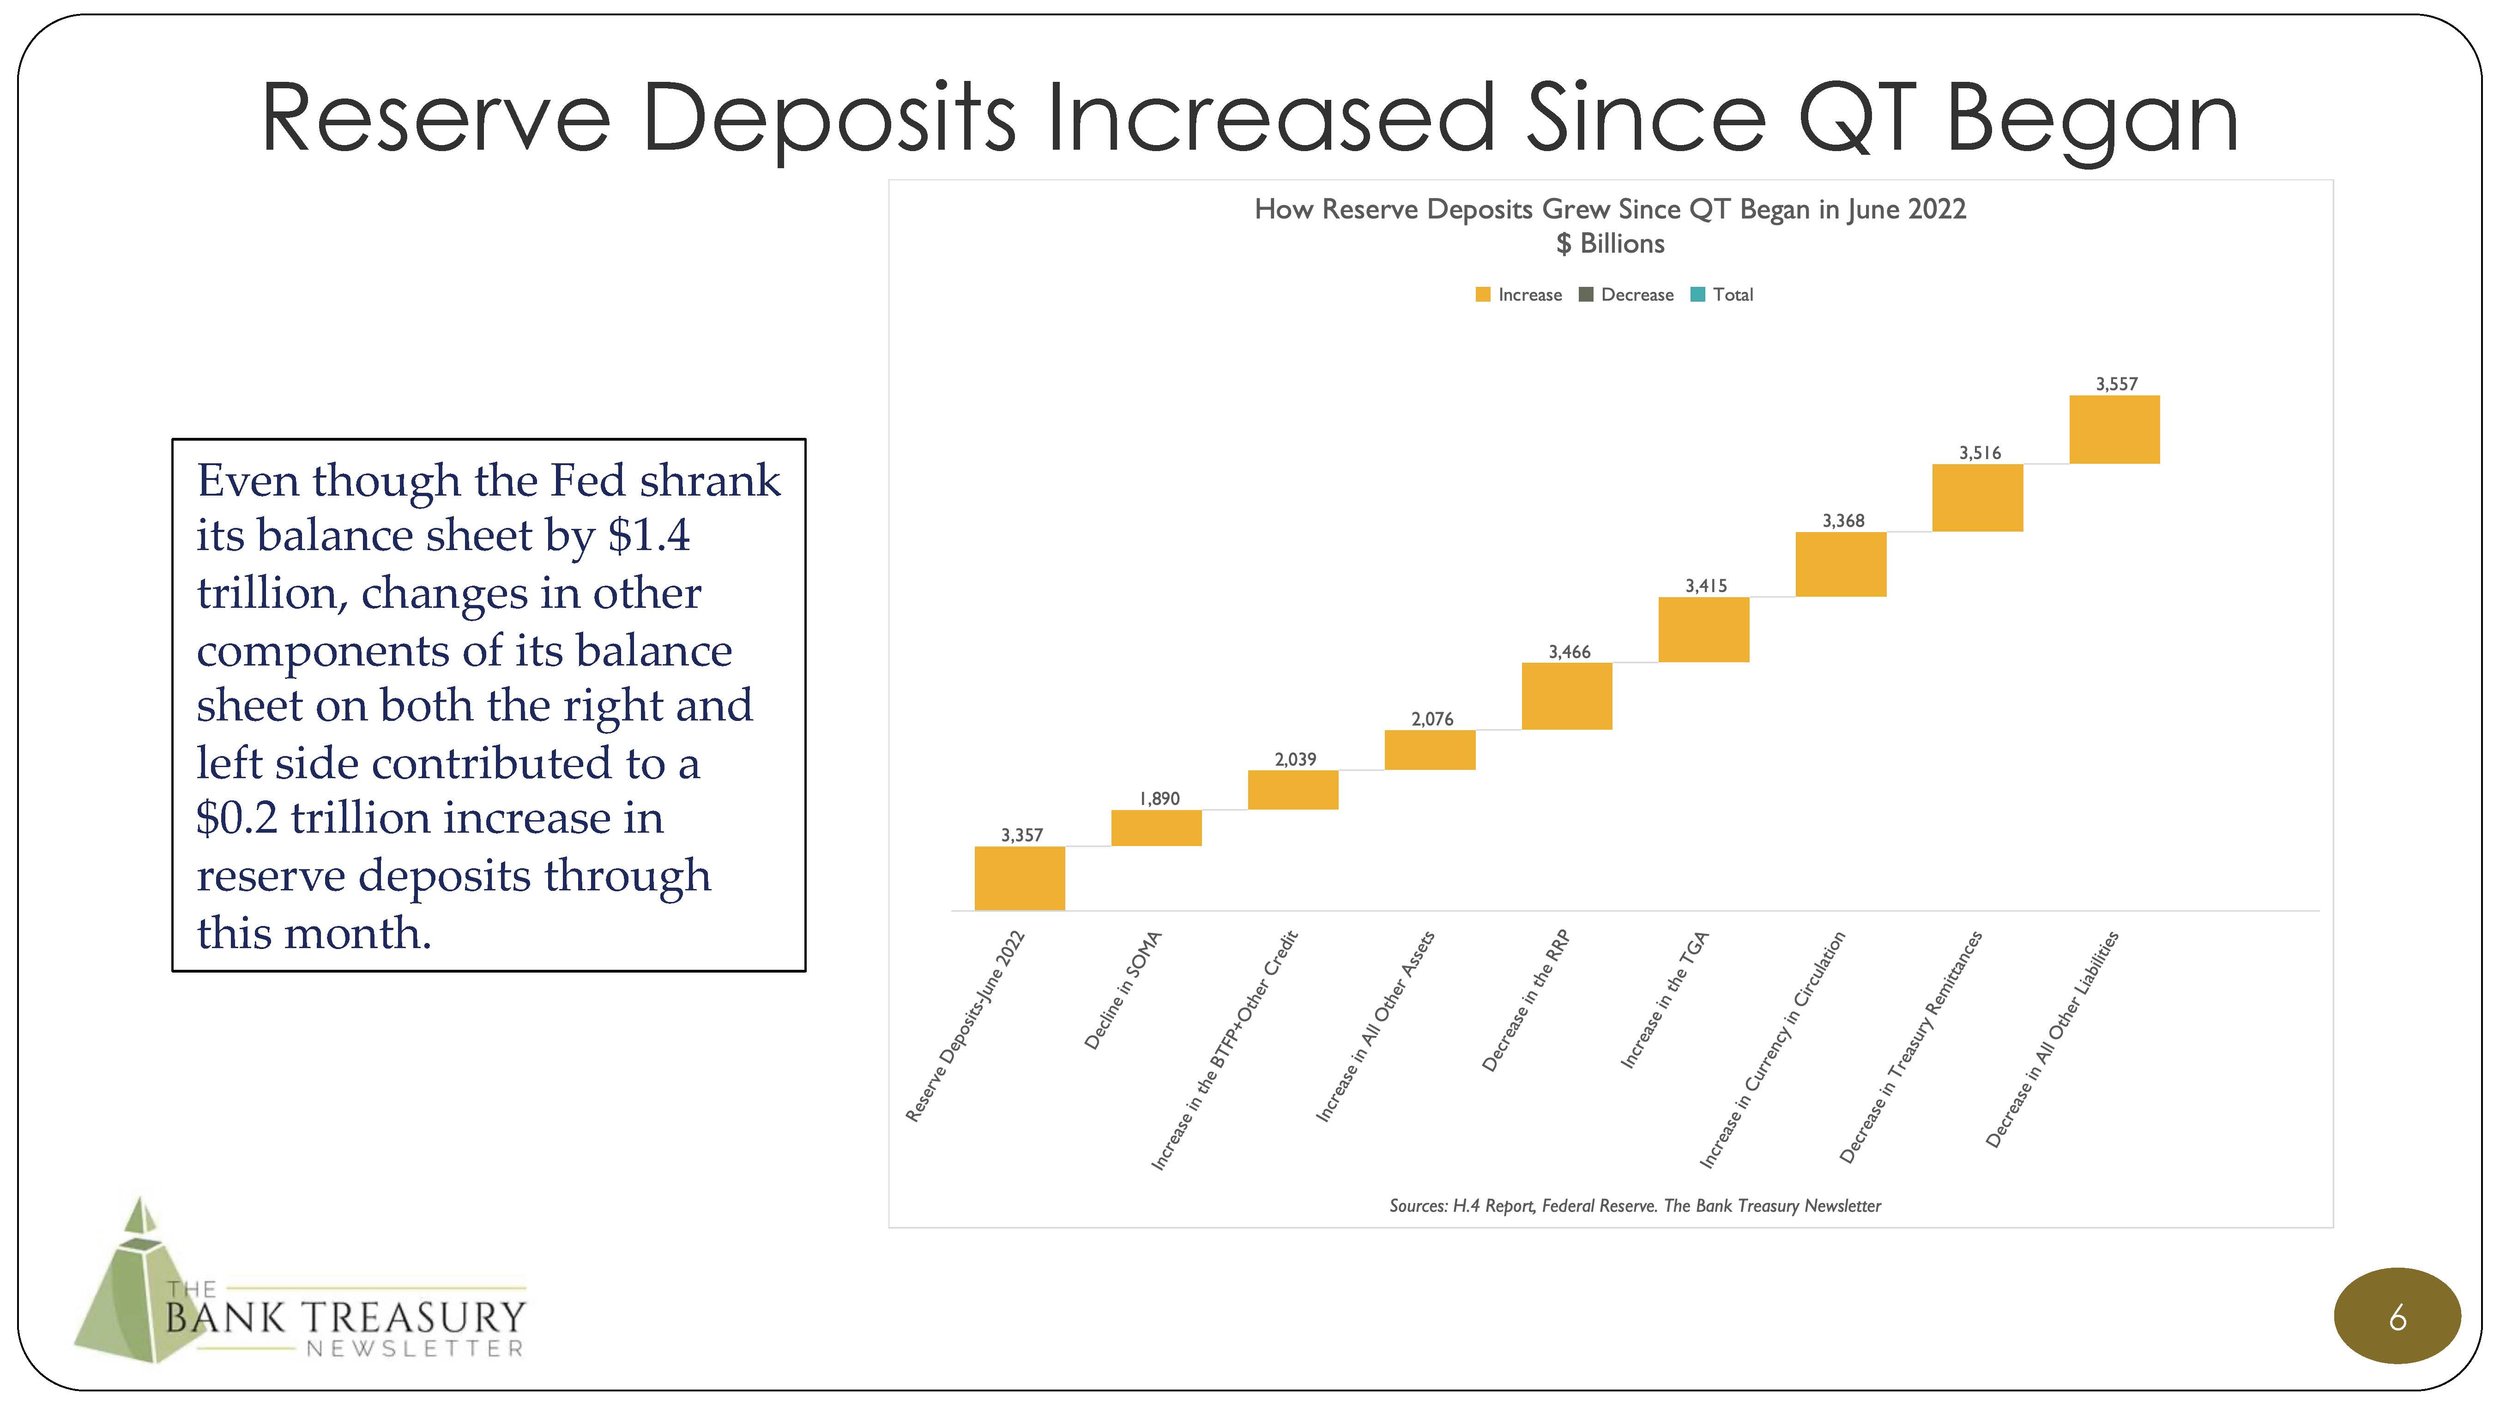
Over on the liability side of the Fed’s balance sheet, the balance of the Reverse Repo Facility (RRP) fell to $575 billion this month, down $250 billion since the beginning of the year, and down more than 75% from its peak last May. The decrease in the RRP and the increase in the BTFP more than offset the decrease in SOMA. However, in addition, cumulative net treasury remittances fell by $25 billion, to minus $98 billion this month, representing the shortfall between what the Fed has earned on its interest-earning assets, including the BTFP and SOMA, less the funding cost for interest on reserve deposits and the RRP. The combination of changes in the Fed’s balance sheet since the beginning of the year, including changes in the balance of SOMA, BTFP, RRP, and negative Treasury remittances, increased reserve deposits by $120 billion, to $3.5 trillion, which is notable because when QT began in June 2022, the balance of reserve deposits equaled $3.4 trillion, since which time SOMA fell by $1.4 trillion. (See this month’s chart deck Slide 6 for more information on the Fed’s balance sheet trends since QT began.)
The forward curve appears to be backing away from its earlier optimism on rate cuts this year. Recent statements by Fed officials, and recent economic data, including inflation, employment, and retail sales, undermine the market’s earlier confidence that the Fed’s first cut in interest rates will come next month. This has caused the 3-month-5-year Treasury-spread to steepen, from an inverted negative 140 basis points averaged last month, to an average negative 100 basis points through the first half of this month. The Fed released the scenarios for its annual stress test, which will require large banks to show how they would manage their deposit funding under a “moderate recession with increasing inflation and rising interest rates, and a severe global recession with high and persistent inflation and rising interest rates.”
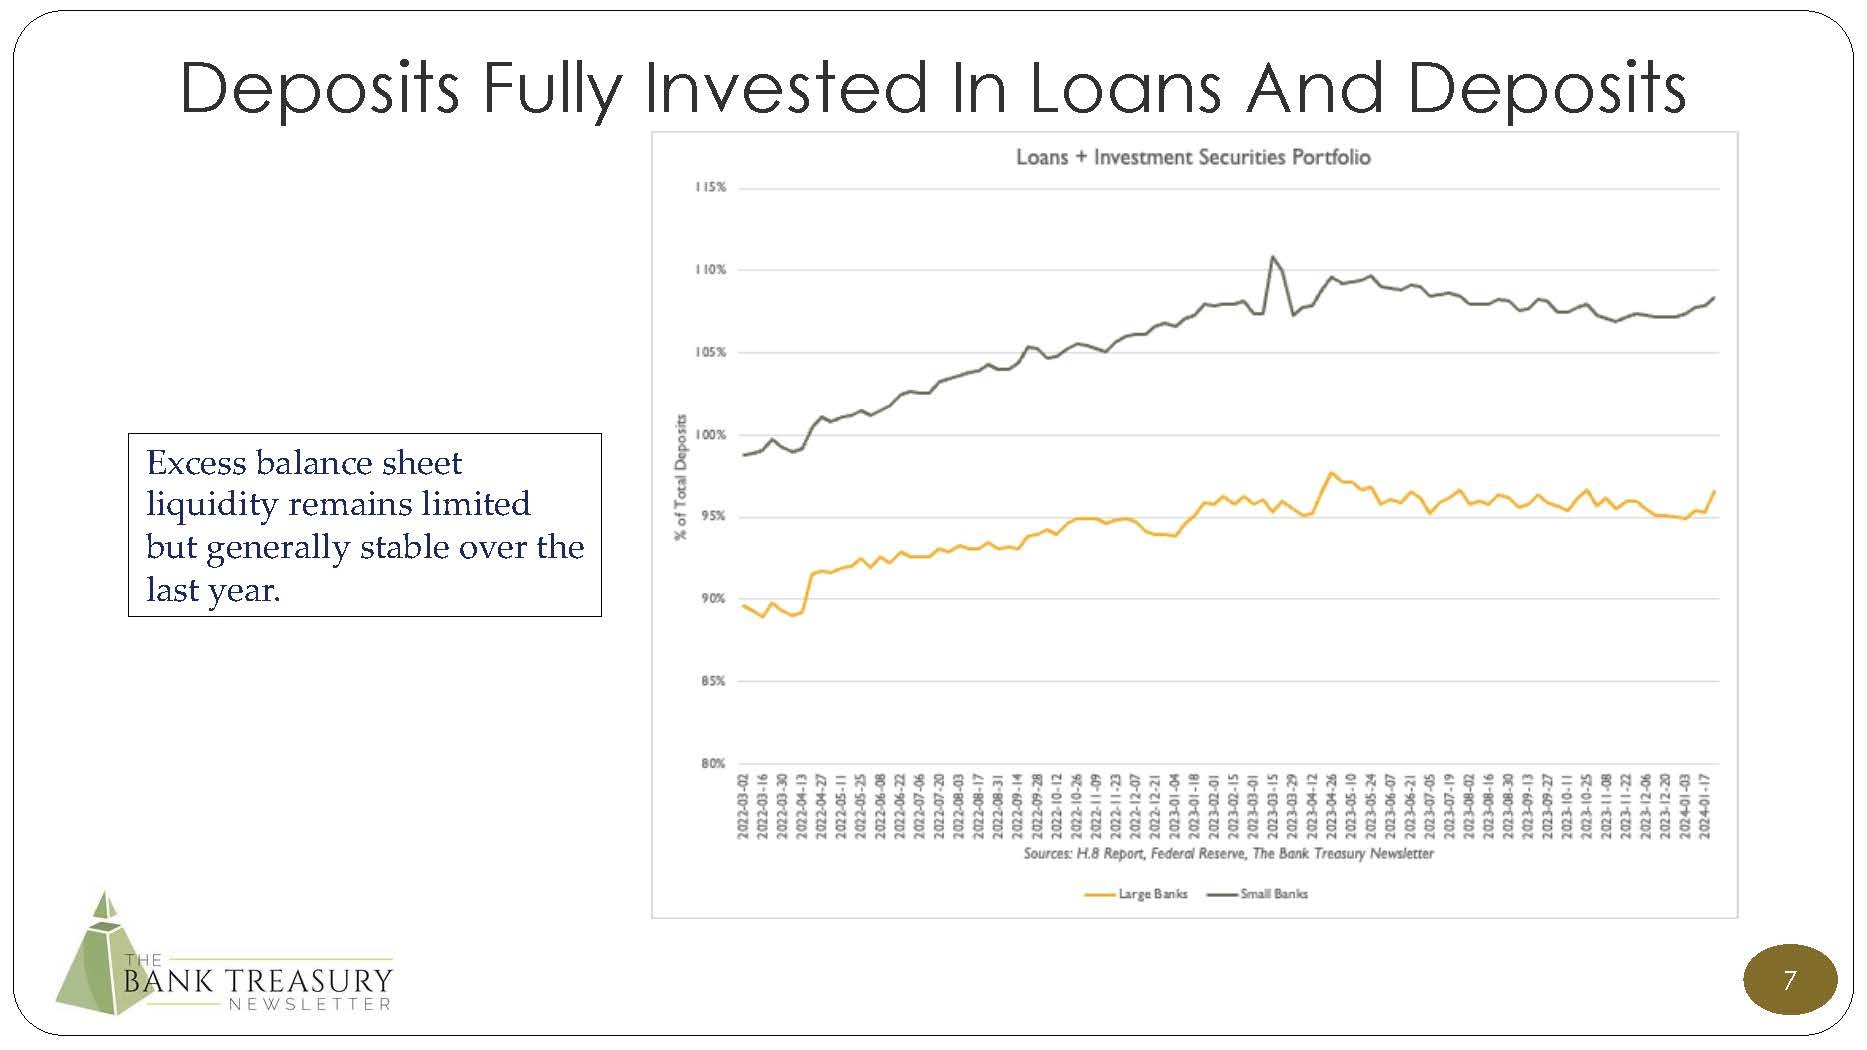
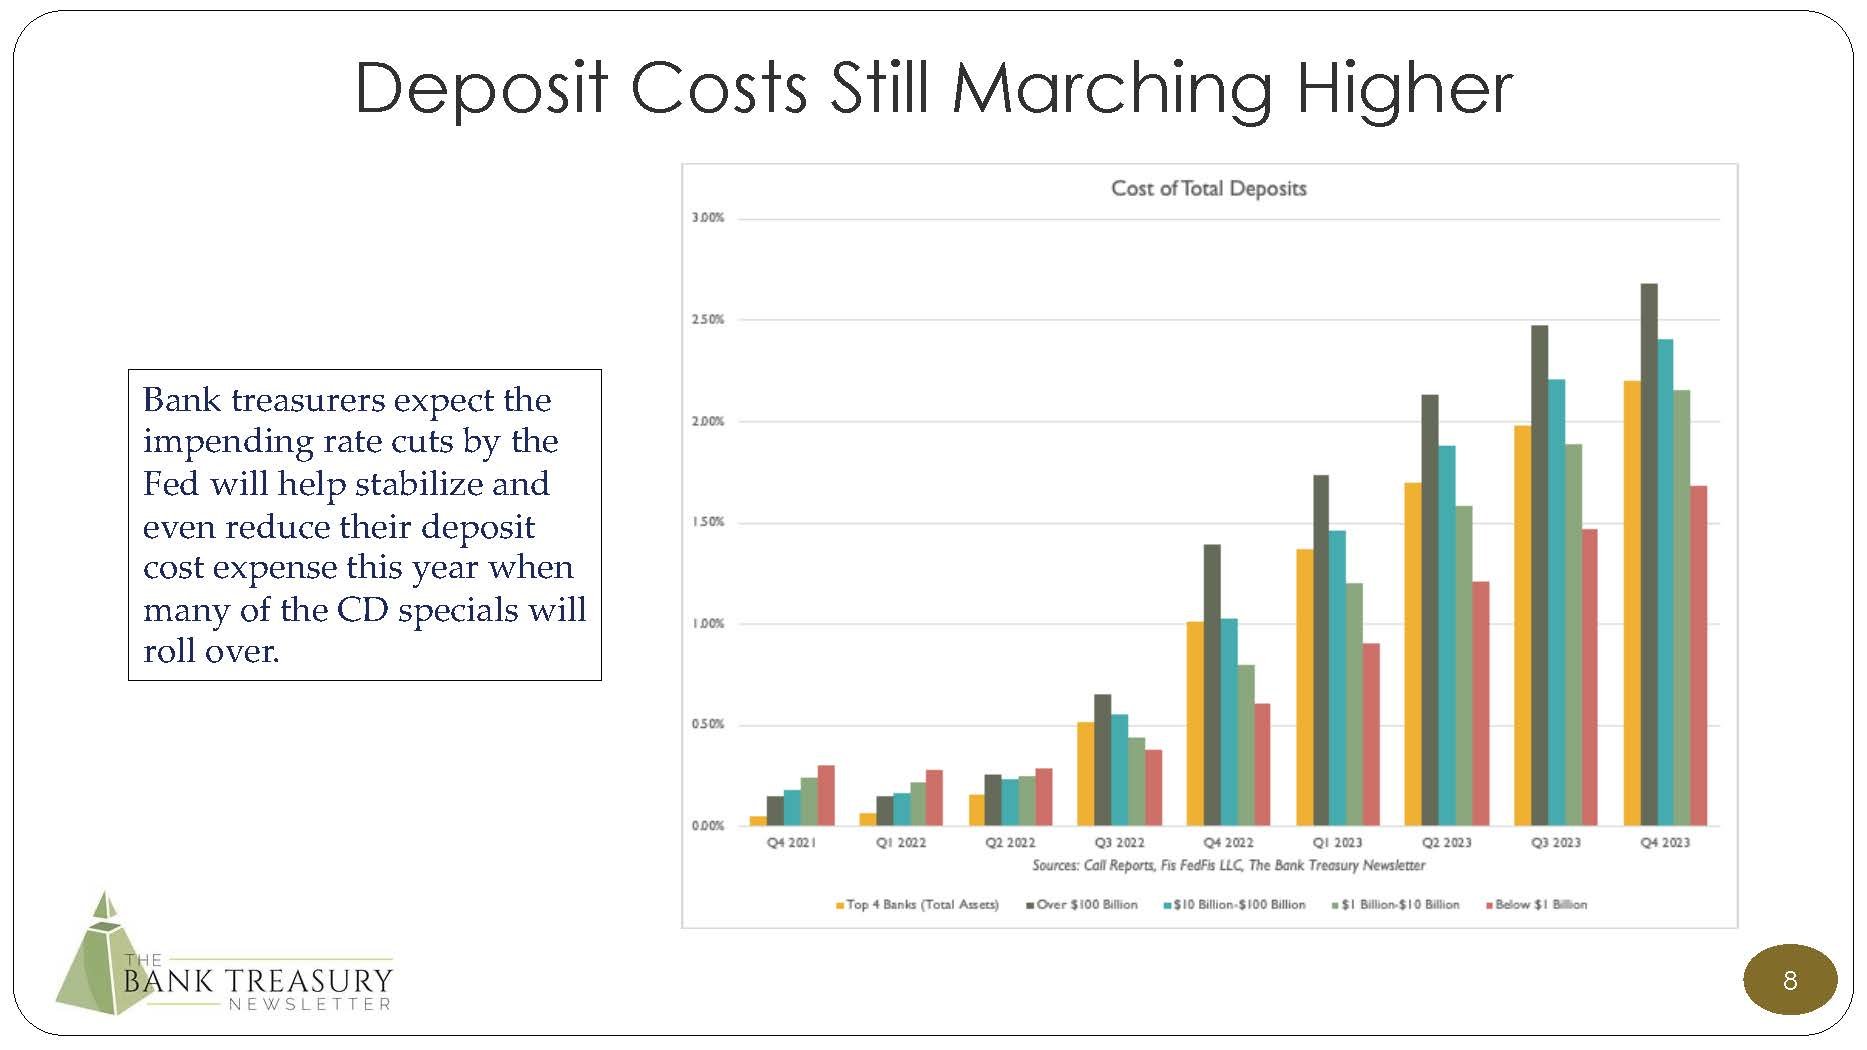
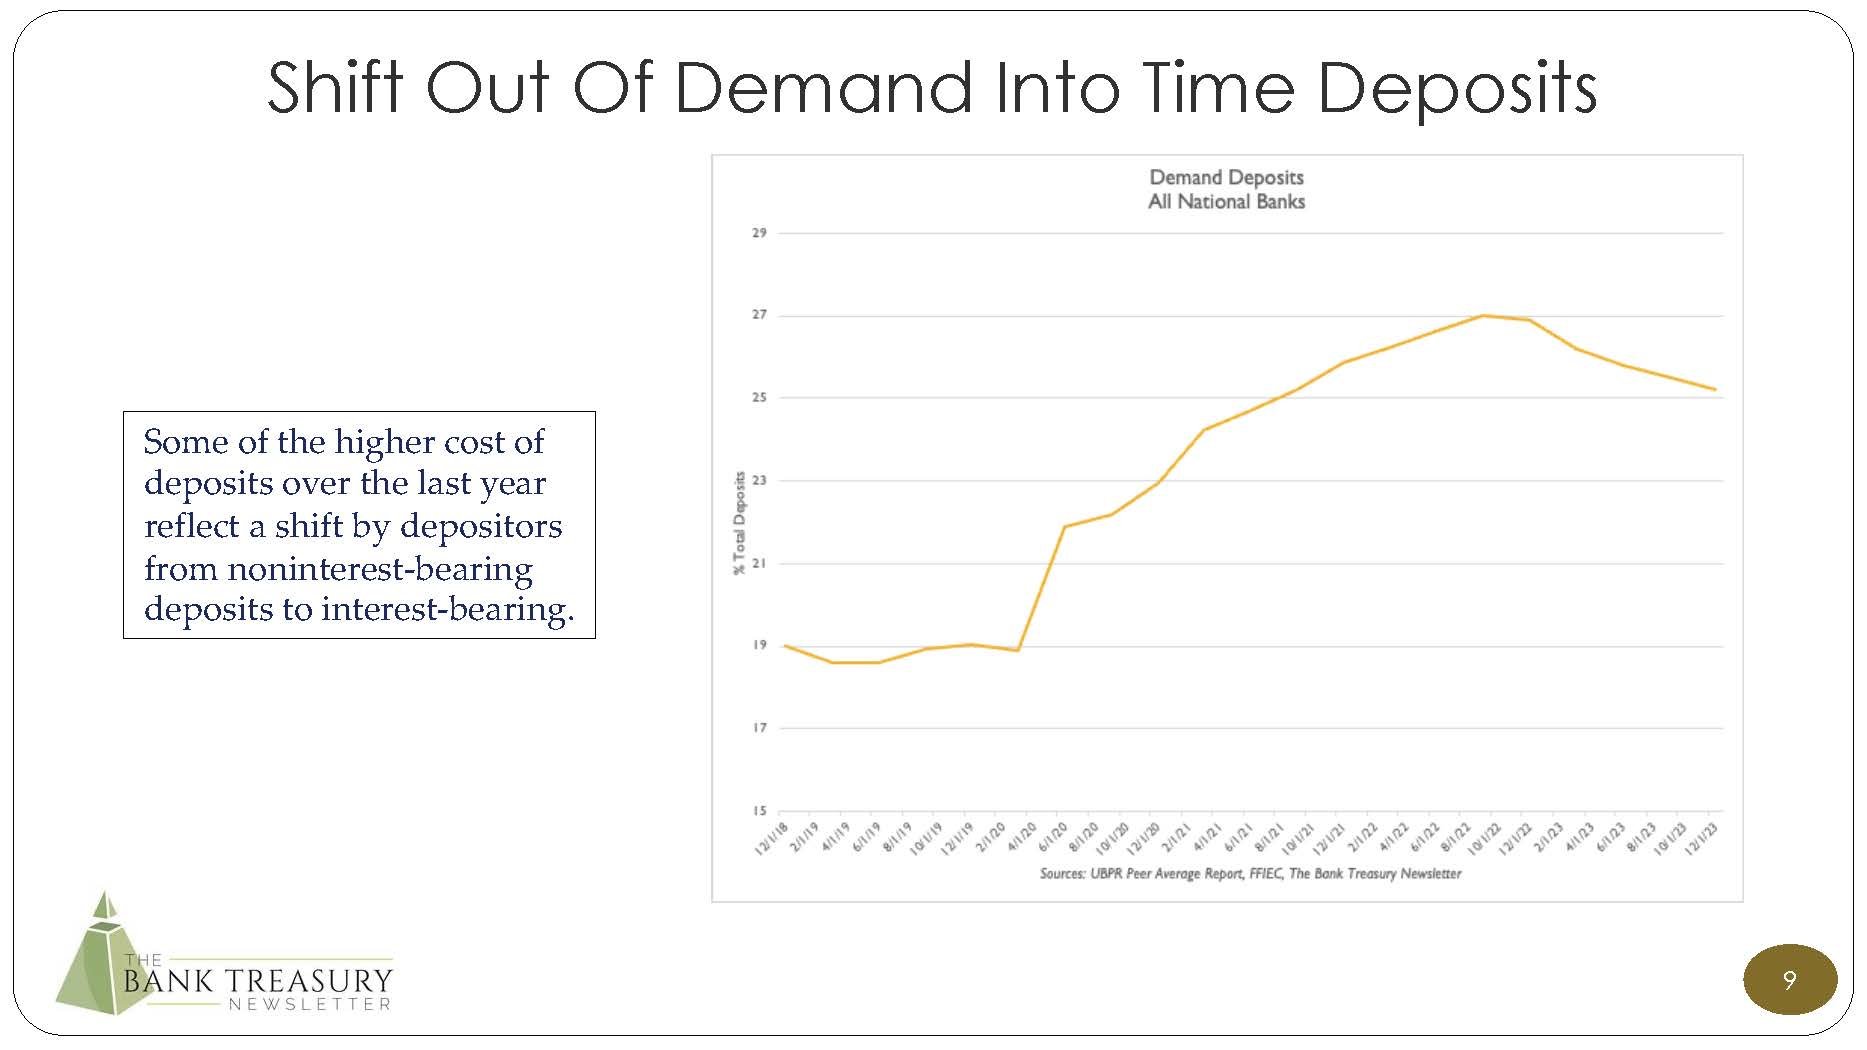
Bank treasurers are privately skeptical about any rate cuts this year, despite what the Fed’s dot plot and the forward curve say, but they are modeling a few cuts in their 2024 projection for net interest income and net interest margin. Generally, they see rate cuts as helping improve earnings under the assumption that a lot of the noninterest-bearing deposits that went into interest-bearing time deposits last year will roll over by the middle of this year to coincide with when they have modeled rate cuts to begin. At the very least, rate cuts will take the pressure off deposit pricing, and many report that deposit rates have already stabilized, and the latest H.8 data report has deposit balances up $0.1 trillion, to $17.5 trillion since the beginning of the year.
In Q4 2023, many banks took advantage of a rally in the market to restructure their underwater bond portfolios, selling bonds and booking losses equal to $3.5 billion. The effect of the restructuring was to reduce duration in the portfolio and their exposure to rising rates. Last year, in the wake of the failure of SVB and the complaint that it had not hedged its bond portfolio, the industry increased its fair value hedges to protect for higher rates. In the meantime, bank treasurers remain most concerned about rates down 300 basis points.
The Bank Treasury Newsletter February 2024

Dear Bank Treasury Subscribers,
Nothing is perfectly balanced or symmetric in the real world. Not everything fits neatly into place, something or someone is forever slightly out of tune, out of whack, or out of step. Clocks do not all chime in unison at the top of the hour, and even atomic time does tick precisely in time with the rest of the universe. This is why physicists a couple of years ago decided to eliminate the atomic second. Indeed, disorder, imbalance, and asymmetry are the essence of life, as chaos theory explains the shape of the universe, and the universe’s entire existence is thanks to a slight asymmetry between matter and anti-matter.
Not every story has a happy ending, there is no lid for every pot, justice does not always prevail, mistakes are made, restatements, revisions, and reassessments are necessarily inevitable, and even the efficient market theory does not tidily explain why forward rates are still projecting more rate cuts this year than the Fed. But contradictions and imprecision are part of life. Two plus two might equal four on a piece of paper, but in life, sums do not always add up to the last penny. Hence, rounding errors are a real thing.
The Federal Reserve’s balance sheet is based in part on its estimation of paper money and coins in circulation, which the H.4 report says equaled $2.328158 trillion on February 15th, 44% of which, according to the Q3 2023 Flow of Funds report, is held by residents living abroad. But this number ultimately is just its best guess dressed up behind a veneer of precision. In truth, the Fed has no way of knowing how many of the $1 bills it issued are stuffed in a charity box, stashed in someone’s safe, buried in their backyard, or otherwise lost and forgotten. And even though banks periodically perform audits where they count out the cash in their branch vaults, that usually does not involve counting out from the teller’s cash drawer denominations below $50.
Presented with a universe of chaos and incalculable possibilities, humans impose order and set about estimating infinity. It is the way we operate. In our minds, everything must fit exactly, we leave nothing unnamed, unaccounted for, and to chance. We are enthusiastic, tireless, and relentless organizers, drawing and redrawing lines in the sand, forever counting out the sands of time and the stars in the sky, and debating the number of angels that can dance on the head of a pin.
No problem is left unsolved, and we believe that once all the assumptions and known facts are stated and arranged in order, it will form a coherent picture. Even complex hybrid financial instruments can be analyzed and accounted for once their constituent parts are broken down and thought out in a flow chart, step by step, root node by root node, decision nodes, chance nodes, alternative branches, and endpoint nodes. Is it a bird or a plane? A bond or an equity instrument? Callable or not? Knock once for no and twice for yes.
We are natural-born accountants. We neatly separate plusses and minuses, costs, benefits, assets, and liabilities, and we like to arrange debits and credits into T-accounts that all add up to the final numbers in the general ledger. We slap labels and values on everything we come across from the physical to the metaphysical, from multi-family and office commercial real estate (CRE), as well as owner- and nonowner-occupied CRE, to mortgage loan servicing assets and core deposit intangibles. Nothing exists save with a name, place, and time in the grand scheme of things.

Going back to the days of Adam, whose first official act as the first human being on Earth, so the Biblical story goes, was to name all the flora and fauna in the garden of Eden, the human mind is all about putting order in the world, even if the order does not exactly fit the reality, even to the point of pounding square pegs into round holes to make them fit. Thus, if it looks like a duck, walks like a duck, and quacks like a duck, it is a duck, even if it is an American Coot or five other birds that resemble it but are completely different species. Adam was thus the world’s first accountant.
Accounting is the process of categorizing financial transactions, assigning them numerical values, and putting them in their proper place on a financial statement. Assets, liabilities, equity accounts, operating, investing, and financing cash flows, revenues, and expenses exist only in the context of the rules that define them. An asset is something you own, a liability is something you owe, and equity is the difference between them. Assets are on the left side, and liabilities and equity go on the right. Why? Those are the rules, as is the rule that the right and left sides must balance out to the penny, regardless that the penny is just an estimate. The values on the balance sheet might seem exact, but as the Financial Accounting Standards Board (FASB) conceded back in 2010,
“To a large extent, financial reports are based on estimates, judgments, and models rather than exact depictions.”
Nothing is perfect, not even accounting, as FASB’s accounting standards are subject to amendments that are regularly superseded by new amendments and revised standards. Even the names for its accounting standards have changed, from the old Statement of Financial Accounting Standards (SFAS) and Emerging Issues Task Forces (EITF) to the Accounting Standards Updates (ASU) and Accounting Standards Codifications (ASC) it publishes today. Even the concept statements of accounting are regularly reconsidered, reworked, and restated.
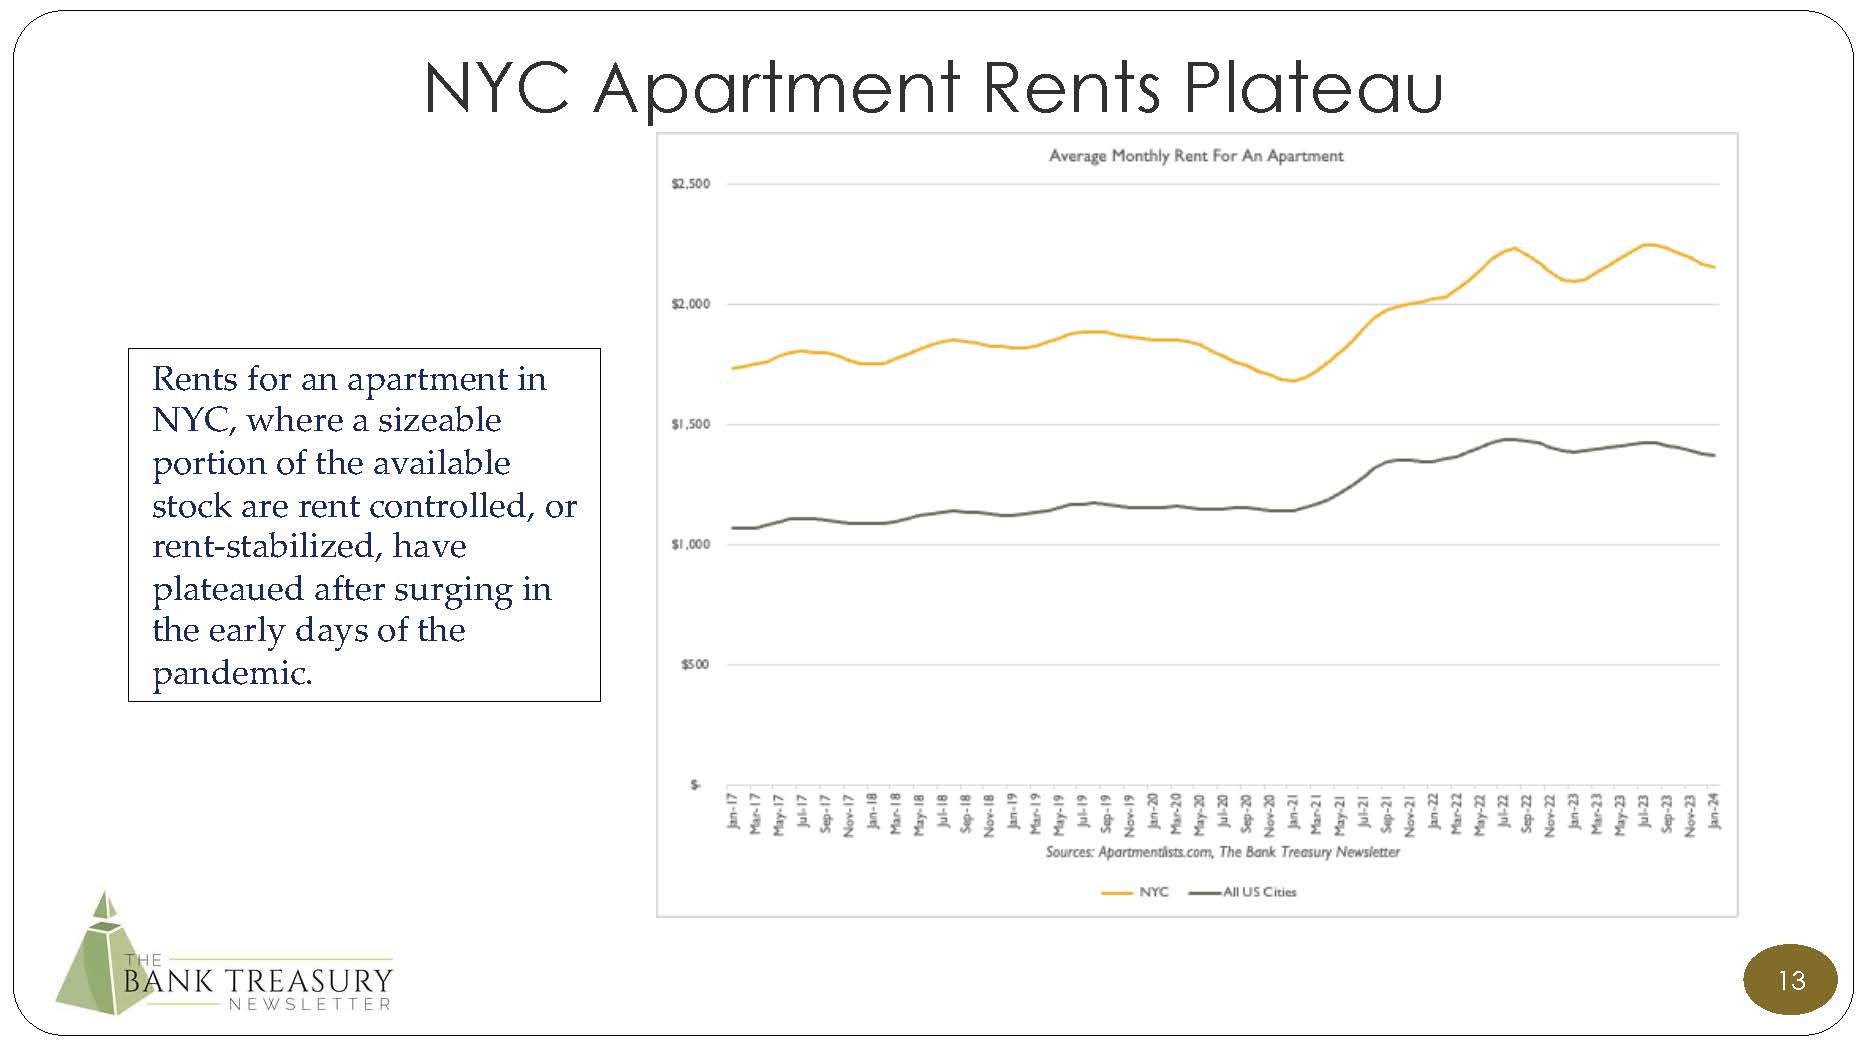
The main purpose of financial statements is to provide useful information to investors. One of FASB’s guiding principles is that fair value provides more transparency than historical cost about a reporting entity’s financial condition. Thus, the average rent-regulated multi-family apartment building in Queens in New York City (NYC) five years ago might have been worth $5 million, but given today’s depressed market and high-interest rates, a lender might insist on a current appraisal before approving a refinancing based on loan to value.

And for good reason. In NYC, the market value of a rent-regulated apartment building could be down by as much as 50% relative to prices pre-Covid, as landlords struggle to cover their growing overhead with rental incomes that are capped and difficult to raise. On the other hand, an estimate that marks a building’s worth down by half may not be any more realistic than the historical cost.
For one thing, it is not like there are a lot of comparable sales of apartment buildings in NYC to back up that appraisal. Apartment buildings are often family-owned and a source of income for them. Their owners have seen and weathered many rate and credit cycles in their lives and are not predisposed to simply sell their cash cows however difficult times are right now. The average apartment building has a few dozen mostly rent-regulated units, has less than a 3% vacancy rate, has tenants that have lived and paid rent in the building for many years, and is situated in a nice, low-crime, working-class neighborhood. Each of its units generates $2,000 a month on average in gross income.
Who would want to sell that asset unless they had no choice? So far at least, most small owners are not desperate, even if they feel the squeeze from higher refinancing rates. But could this change? It is a troubling question the market has been asking, worried about the next shoe to drop with CRE. However, if there are not enough comparable sales to determine current value, appraisers are left using a discounted cash flow model, which has its own set of unobservable assumptions that are not very transparent. This leaves appraisers back to where they started, with the price the owner paid for the building, dated as that might be.
Every balance sheet item has two values, an entry and an exit price, historical cost, and current fair market value. The use of one or the other depends on the balance sheet item in question. Short-term assets are usually represented on the balance sheet at pay-off value or fair market value, while long-term assets are usually carried at historical cost. But this was not always so.
Shall we go through some history? Let’s.
Before the Great Crash in 1929 businesses regularly inflated the current value of their assets to cover problems, and left creditors and investors with next to 0% recovery on those assets when they went bankrupt. The abuse of current value was so brazen, that Robert Healy, the first Chief Accountant of the Securities and Exchange Commission (SEC), who participated in the Federal Trade Commission’s investigation into the causes of the Great Crash, claimed that,
“…in some states, you can capitalize practically everything except the furnace ashes in the basement.”
After the Crash, the SEC clamped down on the use of current value in financial statements, and by 1940, historical cost accounting for long-term assets was the new normal. The new mantra was conservativism, which even for business inventory meant lower of cost or market value. But then came high, persistent inflation in the 1960s and 1970s, and then came high-interest rates, which led to credit problems in bank loan portfolios and unrealized losses in their investment portfolios, which led to the Savings and Loan (S&L) crisis, and other crises during the 1980s.
Financial institutions across the country went under with bond portfolios that were underwater but not marked to market under the theory that a bank’s investment portfolio is a long-term investment. Ignoring the contradiction, from time to time, bank treasurers did sell securities they called long-term investments well before they matured, for asset-liability management (ALM)-related reasons, to tap a key source of balance sheet liquidity to support loans, or to generate gains and losses when needed for tax purposes. All the while they still carried their bond holdings at cost. When challenged that they should be marking their bonds to market for which they had no commitment to hold until they matured, bank treasurers insisted that this would be counter-cyclical and would limit their ability to provide credit to their customers when they needed it the most.
The book value of their bank equity would increase when interest rates fell in a recessionary economy, which would encourage banks to expand credit, and would fall when rates increased in an expanding economy, which would lead them to restrict credit. Besides, the accounting would not match reality if their bond portfolio were marked to market while funding was left unchanged. One side is supposed to be a natural hedge against the other, assuming the bank is a going concern and deposits do not run out the door overnight like uninsured deposits did last spring that caused SVB, Signature, and First Republic to fail.
But getting back to ancient history in the 1980s, the public was up in arms, unpersuaded by the opinion of unrepentant bankers, and unwavering in its demand that something be done, for tighter regulation to prevent banks from playing games with accounting rules. The public would brook nothing less, astonished and outraged by the mushrooming cost to bail out bank depositors at failed institutions. The Federal Savings and Loan Insurance Corporation (FSLIC) was forced to merge with the Federal Deposit Insurance Corporation (FDIC), which left the FDIC holding bond portfolios it received that were marked well below par when it went to dispose of assets. The losses were exacerbated because the S&L industry had also levered up, as it utilized brokered CDs to fund balance sheet growth. The cost to taxpayers was $124 billion.
So, as suspicious as regulators were about banks reporting financial instruments using current value over historical cost, there was no turning back, something had to be done to prevent banks from ever again hiding behind accounting rules to mask losses on their balance sheets when they failed. The FASB, at the direction of the SEC, set up a task force in 1986 to look at moving accounting standards back to current value, or as the FASB calls it, fair value. This is an important point.
Fair value is not a market price. It is not directly observable, and the number used to represent the value of an item in financial statements carried at fair value does not reference a specific bid in the market at the period-end statement date. Instead, it is the price at which an asset could be sold assuming an unforced sale and a stable market. Which on any given date is not a given, especially in today’s volatile markets.

First came fair value disclosures in the footnotes to the financial statements. SFAS 107, “Disclosure About Fair Values of Financial Instruments,” published in 1991 and effective in 1992, required businesses to report the fair value of their financial instruments, both assets, and liabilities, those both on and off the balance sheet, including loans, bonds, deposits, loan commitments, and derivatives, in the footnotes to their financial statements. These disclosures also led to the addition of schedules RC-L and HC-L in the quarterly regulatory reports, which respectively detailed off-balance sheet items held at the bank and the consolidated holding company.
Then, after SFAS 107, FASB zeroed in on two types of financial instruments that businesses would need to report on their balance sheets at fair value, and not just disclose them in the footnotes. Because, nothing against footnotes, they might be a critical part of financial statements, but most analysts do not read footnotes.
Here is a good place to stop and apologize to our readers for spending so much time this month on accounting, but we promise there is a method to the madness, so please continue reading because there is a point here. We know our readers would much rather hear what their peers are thinking on deposit strategies, bond portfolio strategies, or their ALM challenges. We get it. Accounting is not real; it is just a pain. Bank treasurers care about the real world, about total return, not nominal accounting returns, even though accounting is the basis for how they get paid.
Bank treasurers generally do not spend much time reading their bank’s published financial statements, much less the statements published by their peers, hard as it is to see their value add in the publicly reported numbers. Disclosures are too broad to see their contribution to the bottom line from their bond selections, their funds transfer pricing techniques, and their conduct of ALM. To truly appreciate bank treasury’s value-add from a review of financial statements, a user would have to be a bank treasurer, one who knows why numbers on the balance sheet and in the schedules in the footnotes look the way they do. After all, without background and context, numbers are just numbers.
And to be honest, they are generally too scornful of accounting rules which they believe force an unrealistic picture of their bank’s performance, to pay the doings of the FASB much mind. That is unless there are rules in the works that threaten to upend their lives. When SFAS 115, “Accounting for Investment Securities” was published in 1994 and SFAS 133, “Accounting for Derivatives” came in 1999, those were black-letter days in the history of bank treasury. Everything in the bank treasury world changed after those standards came out and the effect of these two standards on the way bank treasurers are sometimes forced to twist into pretzels continues to echo through today.
Just to recount quickly, under SFAS 115, the investment securities portfolio must be reported at fair value, not historical cost, which was the way banks had been doing it since the Great Depression. That is unless bonds were intended to be held-to-maturity (HTM) or were hedged. This was a major handcuff for bank treasurers who consider their securities holdings to be a store of liquidity and do not like handcuffs on their ALM strategies.
Bonds that were not HTM, would go into the available-for-sale (AFS) account, to be carried at fair value. Unlike bonds in the trading account, where daily price fluctuations are reported in noninterest income, changes in the value of AFS would be excluded from the income statement entirely. Instead, unrealized gains and losses on the AFS book would go into Accumulated Other Comprehensive Income (AOCI), a component of comprehensive income, which is part of stockholders’ equity.
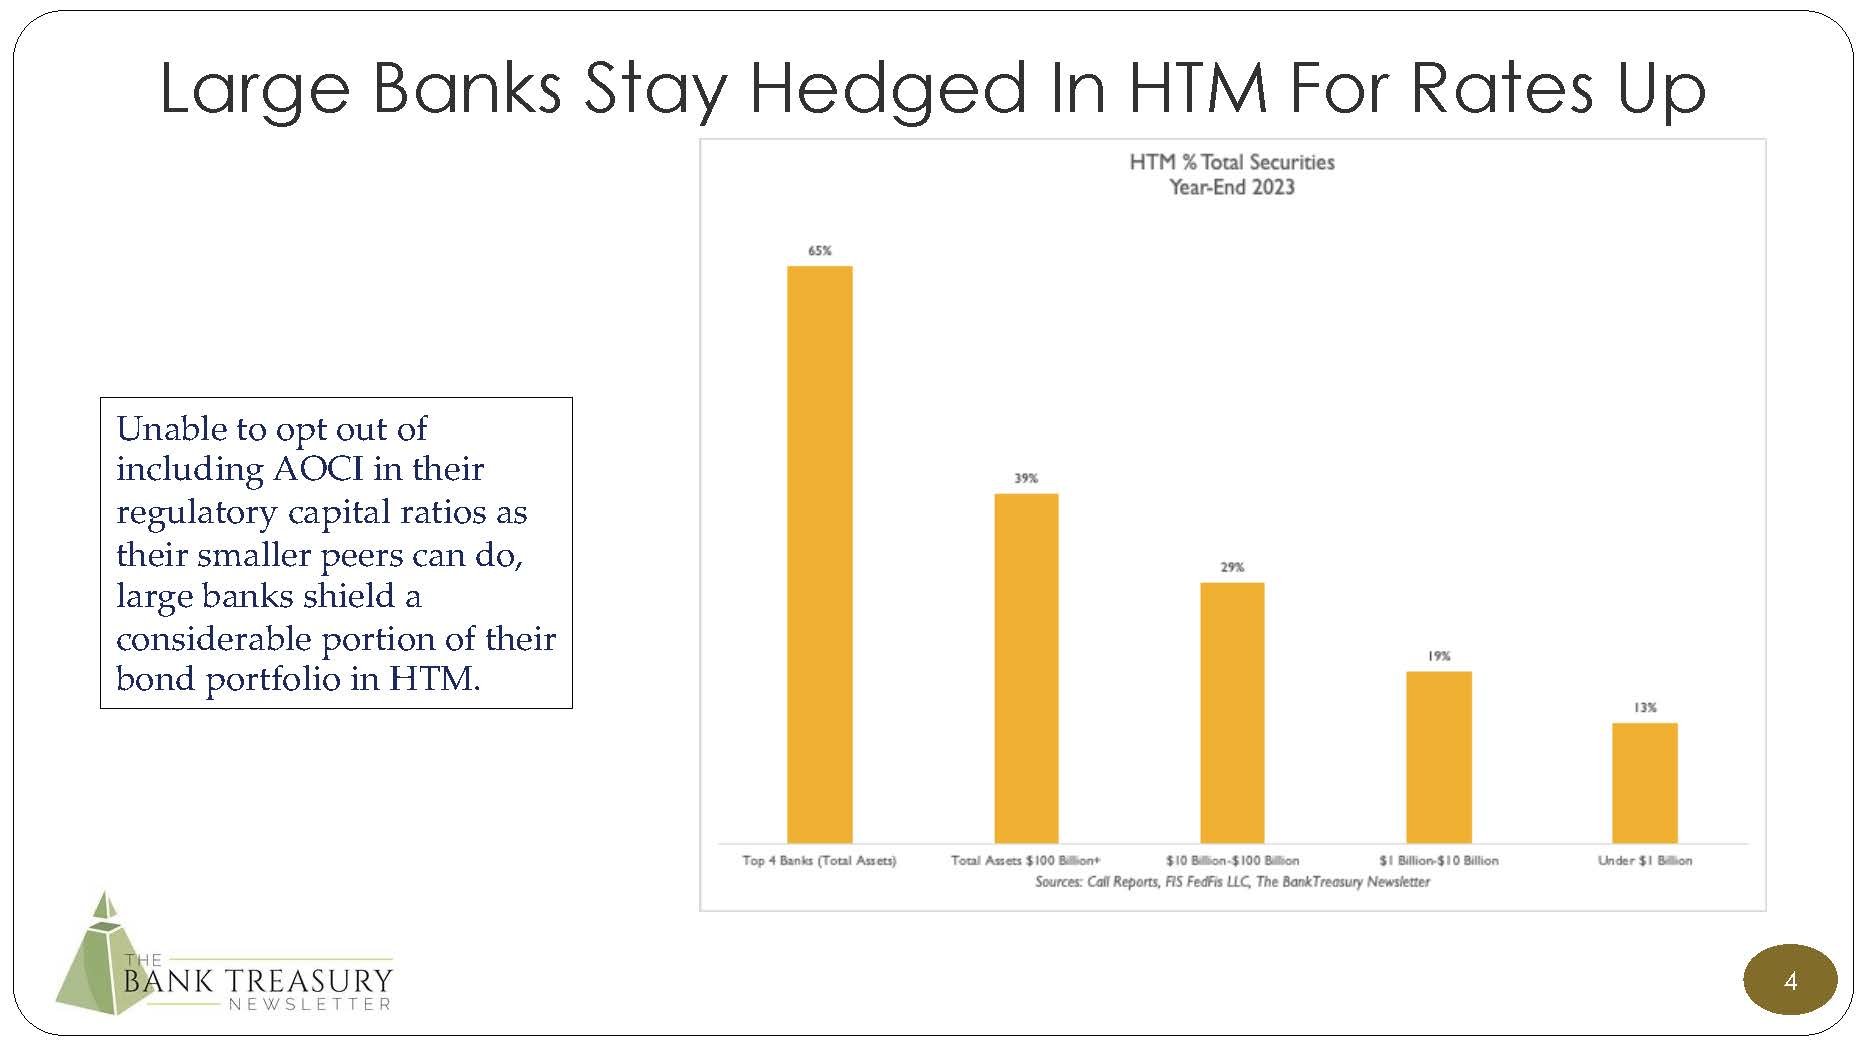
HTM has come in for a lot of criticism since the fall of SVB last spring because more than half of its portfolio had been locked away in that account. However, the FASB for now seems committed to leaving the accounting unchanged. Bank regulators, on the other hand, may be thinking of adding some restrictions on its use by large banks, though nothing has been proposed to date. See Slide 4 in this month’s chart deck for more detail on the proportion of securities that banks hold in HTM.
SFAS 115 was a headache for small institutions without the accounting staff to interpret what the latest accounting interpretation meant for their portfolios or a board of directors that could appreciate its complexities. As far as FASB was concerned, their goal was achieved even if SFAS 115 only covered the investment portfolio. Loans would still be reported at historical cost, and deposits would be reported at their cash pay-off value on the assumption that they could be withdrawn at any time at that pay-off value.
Lopsided accounting or not, its counter-cyclicality aside, there was no going back as far as FASB was concerned to the bad old days of historical cost. It would place its trust in the auditors to make sure that businesses were not just inflating the value of their assets to get out of trouble like they did before the Great Crash. We do not need to caution why such faith could be misplaced, why auditors can miss fraud that often lies in plain sight, though names like Enron, WorldCom, and Madoff come easily to mind.
Regardless, SFAS 115 left the banking industry’s generally accepted accounting principle (GAAP)-based capital position subject to the volatility of the rate cycle, hostage to the latest turn in the Fed’s monetary policy. Thus, as the Fed raised rates in 2022-23, AOCI for all commercial banks (Figure 1) plunged to negative $332 billion by the end of Q4 2022 and then fell to negative $337 billion in Q3 2023. AOCI recovered a bit in Q4 2023, when the bond market rallied in anticipation of rate cuts by the Fed this year.
But then, since the beginning of the year, the intermediate and longer end of the yield curve, where most of the industry’s portfolio is priced, backed up, as the market came to terms with the realization that the Fed’s first interest rate cut is likely not coming next month, after all, given recent economic data suggesting that inflation is not fully vanquished. Since year-end, for example, the yield on the 10-year Treasury increased from between 40 to 50 basis points, to 4.3%. where it trades today.

Figure 1: Negative AOCI: All Commercial Banks
Bank treasurers are still sleeping better, even with the back-up in rates. Many regional banks restructured their bond portfolios in the second half of last year, selling bonds and booking losses (Figure 2). As a result, they have shorter-duration portfolios that may be less sensitive to rate volatility. The chairman and CEO of a regional bank based in the south told analysts this month that his bank’s sale of securities from the AFS portfolio resulted in a portfolio with,
“…shortened duration, lowered risk weighting, and improved cash flow.”
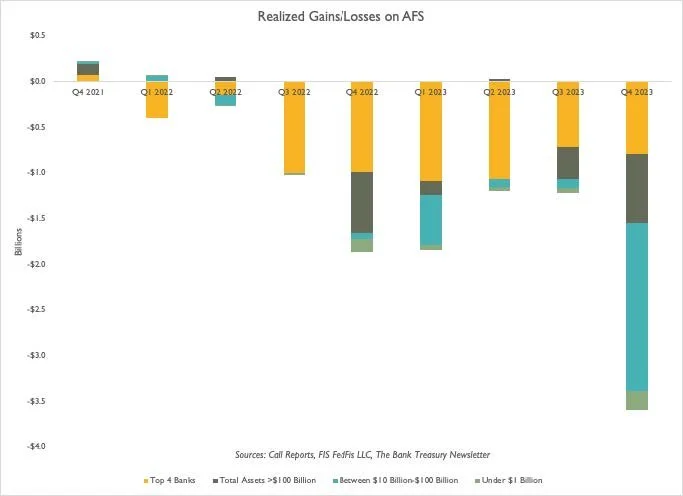
Figure 2: Realized Gains/Losses on AFS
Adding to this color, the bank’s CFO described some of the bonds purchased and the objectives for the restructuring,
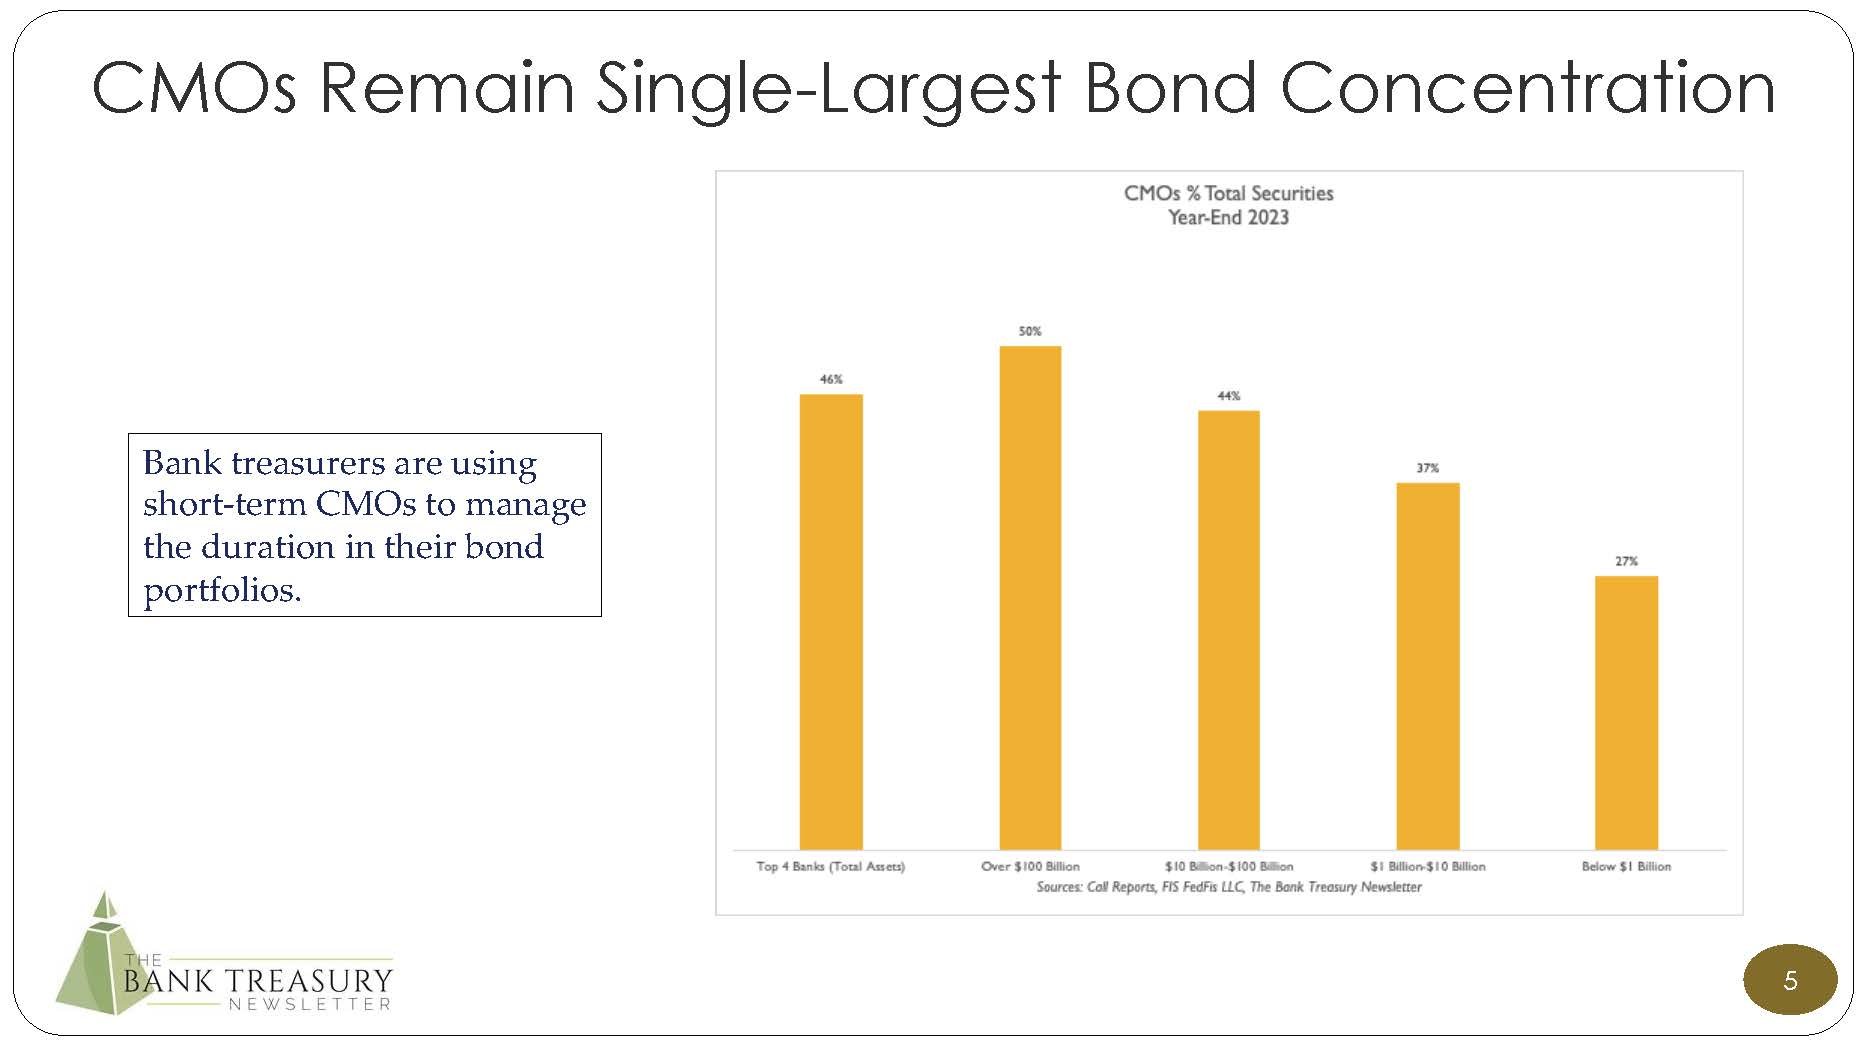
“… a variety of different products: front-end, sequential, Ginny Mae, CMOs, laddered treasuries, a few SBA floaters. We are focusing on shorter duration, focusing on products that ensure adequate cash flow. The cash flow is important to us coming off this securities portfolio, again, focusing on liquidity and flexibility with our loan growth.”
SFAS 133 had the same point as SFAS 115, to expand the application of fair value in financial reporting. Under the original standard and still principally the same today, all derivatives had to be reported at fair value unless they were used in a hedge. Even so, the qualifications for a hedge under SFAS 133 were strictly defined, intentionally to limit the application of hedge accounting and expand fair value reporting for financial instruments. There were fair value hedges for fixed-rate financial instruments and cash flow hedges for floating-rate financial instruments.
Hedges had to be effective, meaning that the derivative used to hedge an on-balance sheet financial instrument had to be clear and closely related and prices of the two financial instruments had to be in sync, including their respective terms, which had to be matched. Hedge accounting was also very complicated and the risk of running afoul of its requirements could be devastating if hedges had to be unwound. Banks learned this the hard way.
There were two methods for proving effectiveness, the long haul and shortcut method, the hard way, and the easy way, but to qualify for the easy shortcut method was complicated and hard. In 2006, some banks sold brokered CDs to investors with death puts and hedged the CDs using the short-cut method. Then they were forced to unwind their hedges and realize losses on the derivatives when auditors determined that these CDs were not eligible for hedging, whether the short or long-haul method were used.
Before SFAS 133 came along, hedging was relatively simple, and documentation requirements were not too intense. After it came out, many bank treasurers considered hedging to be more trouble than it was worth, especially for MBS where its prepayment risk meant that the hedged item and the hedging instrument would not have matching terms. Combined, SFAS 115 and SFAS 133 were a nightmare of uncertainty for bank treasurers, as accountants tried to apply the rules to hybrid financial instruments that defied simple accounting classifications.
In 2007, after bank treasurers learned that death puts had to be bifurcated and valued separately from the host CD contract at fair value, there was a huge debate at the FASB about collateralized mortgage obligations (CMOs) and the embedded derivative prepayment option that investors effectively sell to the mortgage holder. The question was whether under SFAS 133, bank treasurers had to bifurcate that derivative and value it separately at fair value, or whether the derivative was inseparable from the host contract.
Bank treasurers were deeply concerned given their significant investment in the product how FASB would decide. According to Q4 2023 call reports, CMOs account for 45% of the industry’s aggregate bond portfolio. They did not sign up for bifurcating derivatives in CMOs and marking to market something that had always gone unrecognized and unvalued in financial statements. The wrong decision might have forced them out of the product and done significant damage to the MBS market. If the embedded derivative in CMOs had to be bifurcated and valued at market, bank treasurers worried that even the CMOs they put in their HTM account might not be safe.
FASB held a public meeting in December 2007. It was broadcast live on every hoot and holler in the land, and bank treasurers, MBS sales, and trading staff listened to the entire proceeding, poor sound quality and all, in suspended silence. All trading, all phone conversations, and all posting of new bid-wanted-in-competition lists were paused. And then came the “all clear.” FASB decided that most CMOs were fine, including Planned Amortization Class (PACs) CMOs and sequential payments, interest-only (IOs) and principal-only (PO) paper. None of these CMOs required bifurcation.
Inverse-floaters were the only CMO that FASB thought might not be exempt because the embedded derivative did not meet SFAS 133’s requirement that it be clear and closely related to the host contract and pass the double-double test. The double-double test says that an embedded derivative cannot increase the rate of return on a host contract, initially or under any scenario however unforeseeable, by more than double.
As FASB reasoned back then, the inverse floater has two derivatives, one connected to prepayment risk and one an inverse floater derivative, and there were scenarios where the combined effect of the two derivatives could result in a return that was double the contracted return. However, bank treasurers generally did not invest in inverse floaters, which were mostly hedge fund products. And hedge funds were not public companies and so did not care what FASB said, anyway.
So, in the end, it was a win-win.
Regardless of the decision, because they could prepay, SFAS 133 made hedging MBS very difficult. Without hedging as an option, when they have worried that interest rates will go against them after they have bought bonds, and worried about GAAP-type metrics, such as the tangible common equity ratio that must be positive for a bank to be eligible to borrow from its Federal Home Loan Bank, bank treasurers just checked the MBS they bought into their HTM account and forgot about them. Also, from a regulatory capital standpoint, unless a bank’s total assets were over $250 billion (or over $100 billion under the Basel 3 Endgame if it is finalized as proposed), banks can opt out of including AOCI in their calculations.
HTM cannot be hedged, but at least bank treasurers could take comfort in the understanding that future fluctuations in the fair value of their bonds in HTM would be relegated to the footnotes where they will go unnoticed by analysts, instead of the balance sheet or the income statement. According to Q4 2023 call reports, at year-end 2023, 54% of the bond portfolio held by banks with total assets over $100 billion was in HTM. That number falls to 23% for the rest of the industry.
A decade after the FASB meeting, FASB board members had a change of heart about hedge accounting and concluded that the rules could be relaxed for MBS despite the product’s prepayment risk. Despite its preference that all derivatives should be marked to market except in the “rare” circumstance that it was used in a bona fide hedge, maybe not all derivatives are bad, and maybe not all hedges are questionable, board members thought, many of whom were not on FASB when SFAS 133 was published in 1998.
In August 2017 it passed ASC 815, “Derivatives and Hedge Accounting.” The rule created a new “last of layer” hedge accounting method for fair value hedges of prepayable assets, where a bank could designate a single closed portfolio of MBS for a partial term hedge. A key requirement was that it could prove that this designated “layer” would remain outstanding for the period of the hedge.
FASB might have intended to make it easier for bank treasurers to hedge their fixed rate MBS portfolios, but its “last of layer” accounting amendment was a dud. Bank treasurers did not early adopt the standard when it came out and take advantage of its one-time “get-out-of-jail” provision letting adopters move securities that they had booked in HTM back into AFS where they could be hedged. When rates went to 0% during Covid, bank treasurers just stuffed the new bonds they bought in HTM, or otherwise left them in AFS unhedged. SVB was not the only bank unhedged when the Fed began raising rates in March 2022.
There were a few reasons why bank treasurers did not care about ASC 815. Hedging does not come without costs. So, when rates were at 0%, and the Fed’s forward guidance in 2021 was as dovish as it was, spending money from what meager return they earned on bonds to protect against what then seemed like a longshot chance that the Fed would move higher and faster on rates would have been a tough sell in the board room. Derivative hedging was probably even a tougher sell at smaller banks, where members of the Asset-Liability Committee on the board of directors may have limited understanding of derivatives and may be deeply suspicious of them.
Warren Buffet’s famous dictum is likely framed on the wall next to their pictures in the board room, and many may know by heart what he wrote in his 2002 annual report, that derivatives are the agents of mass destruction and that Wall Street traders are ripping off their customers and shareholders,
“I can assure you that the marking errors in the derivatives business have not been symmetrical. Almost invariably, they have favored either the trader who was eyeing a multi-million-dollar bonus or the CEO who wanted to report impressive “earnings” (or both). The bonuses were paid, and the CEO profited from his options. Only much later did shareholders learn that the reported earnings were a sham…In my view, derivatives are financial weapons of mass destruction, carrying dangers that, while now latent, are potentially lethal.”
And, as much as FASB intended to simplify hedge accounting, the “last of layer” method was still too complicated, too cumbersome, too inflexible, and too not worth the time, effort, and brain cells to kill for bank treasurers to come up to speed and understand how to apply it to their MBS portfolio. Easier to just stuff it in HTM. And, for smaller banks with less direct access to Wall Street, hedging is expensive. There is a cost to complete the International Swaps Dealer Association agreement paperwork, maintain margins, and handle collateral required to support a hedging program using a series of interest rate swaps.
So, FASB doubled down on its effort to dial back some of the restrictions that SFAS 133 put on hedge accounting and published ASU 2022-1 in August 2022. ASU 2022-1 permits banks to designate multiple layers of a single closed portfolio of MBS for last-of-layer accounting. Under the original rule, only one layer was permitted. ASU 2022-1 was all about flexibility,
“In applying hedge accounting to multiple hedged layers, an entity has the flexibility to achieve hedge accounting using different types of derivatives and layering techniques that best align with their circumstances (for example, spot-starting swaps, forward-starting swaps, or a combination of both).”
Despite FASB’s improvements to the “last of layer” method, bank treasurers remained slow to incorporate it into their ALM strategies, and MBS portfolios going into 2023 went largely unhedged. In February 2023, after the Fed had just raised the target range of the Fed Funds rate by 25 basis points to 4.75% to 5.00% and had warned it was inclined to raise rates higher (which it did last year in March and May), bank treasurers were still more concerned about the Fed cutting rates than feared it hiking them.
Hedging their MBS portfolios to effectively turn a fixed rate financial instrument with prepayment risk into a floating rate, was not exactly in line with their general ALM strategy, however much in hindsight that would have been a brilliant move. Even today, a year later, most bank treasurers will tell you they are still more worried about protecting for rates down than rates up. Maybe even more so given the Fed’s new guidance.
Having said that, the failure of SVB and the revelation that it did very little to hedge the interest rate risk in its bond portfolio pushed a lot of banks to suddenly add fair value hedges in Q2 2023 (Figure 3). The largest banks by total assets might have let some of these hedges run off in the third and fourth quarters. But generally, whether it was ASU 2022-1 or the shock of SVB, Q4 2023 call report data suggest that their fear of down 300 basis points aside, going into 2024, bank treasurers were more hedged for rate hikes than they were going into 2023.

Figure 3: Pay Fixed Swaps (Notional Amount) Not Used for Trading
Which given what the bank treasury world went through last year is understandable. Even the Fed’s stress tests this year incorporate the risk of higher for longer and a shallow recession. While the severely adverse scenario in the 2023 stress test had the economy crashing and rates falling to 0% virtually overnight, the hypothetical stress test scenarios for 2024 envisioned a couple of new tracks for rates. As the Fed described,
“Two of the hypothetical elements include funding stresses that cause a rapid repricing of a large proportion of deposits at large banks. Each element has a different set of interest rates and economic conditions, including a moderate recession with increasing inflation and rising interest rates, and a severe global recession with high and persistent inflation and rising interest rates.”
Every bank balance sheet is different, some are set up for rates down, some more so, some less so. The CFO from a community bank on the West Coast told analysts that his bank was not modeling in any rate cuts for Q1 2024,
“In the first quarter, we don't anticipate…any rate cuts.”
The CFO from a larger regional bank in the southeast said the bank would profit if the Fed ended up holding off on rate cuts this year, or cut them less than the dot plot or the forward curve suggest,
“If rates don't decline, if they were to stay right where they are, it would impact our net interest income positively.”
Up in New England, rate cuts would help profits, according to the CFO at a community bank,
“We're envisioning that when rate cuts happen, that we will see a benefit. We do think that it will certainly take some time to see that come through in the funding side…in the second half, we anticipate margin expansion.”
If the Fed starts to cut interest rates in the middle of the year the treasurer of a community bank in the northeast expected his bank to report better earnings at the margin.
“We would be able to benefit, especially our cost of funds, but I don't think it's going to be a sea change…Hopefully, as our assets reprice, we will start to benefit and see some increase in net interest income.”
More Rate cuts would help the performance of a community bank on the West Coast, as its CFO cautioned that less would hurt a little,
“If we get fewer rate cuts this year our outlook will -- it will probably get a little bit worse, but not substantially.”
More than the three cuts as the Fed’s latest dot plot laid out would be great for earnings at a regional bank in the Midwest. The reason, its CFO explained, is tied to its deposit strategy,
“If there's more than three rate cuts, that's going to be a benefit to us. You know, we have over 50% of our CD book maturing in the first half of the year and 90% by the end of the year. We have 17% of our deposits tied to an index money market.”
The CFO from a community bank in New England told analysts the bank was in the same position, set up to profit from more rate cuts,
“Over 90% of our book on the CDs reprices over the next year.”
Having attracted deposits with promotional rates, the CFO from a regional bank in the southeast expected to see benefits when rates fall on CD rollovers,
“A portion of those CDs still have a promotional rate, but a large portion of those will also roll over into some of the routine levels. So, as you look at the year, we do anticipate some average improvement from those CD rollovers.”
But then again, the ideal scenario would be no cuts, as far as the CFO and treasurer of a regional bank based in the mid-Atlantic states was concerned,
“Generally speaking, if the rates stay high like this, that's better for us…A Goldilocks scenario for us would be one or two cuts because that bursts the bubble a little bit on deposit expectations and might even take pressure off deposit rates. But…we've already seen some easing…without the actual cuts…If you have a slow pace of rate cuts or no cuts, then that takes the repricing pressure off the variable rate portfolio and the fixed portfolio will continue to price upwards.”
And responding to an analyst question, about how banks can generate net interest margin even with an inverted yield curve, the above-quoted CFO and Treasurer explained the math,
“The incremental rate on new originations is about 7.80%. The incremental cost of funds is right around 5%. If we borrow the money overnight, it's 5.36%. But if we gather money through our money market specials at 4%, and our CD specials are split between 5.25% for seven months and 4.85% for one month…the all-in rate of new funding is probably in the high 4%s. That gives you a 3% spread.”
And you do not have to be the best bid in the market to earn that spread. The chief revenue officer at a mid-Atlantic-based regional bank added that as competitive as deposit rates have become, there is still something to be said for relationship banking,
“I also think that because our customer base, by and large, has been with us for a long time, they don't need the absolute highest rate. They need to be treated fairly and they want to think that they're being treated fairly.”
One major downside of less rate cuts in 2024, at least as far as investment bankers are concerned, is that negative AOCI will continue to dampen merger and acquisition (M&A) activity in the industry. Everyone expects significant consolidation, but negative AOCI is effectively a deal-breaker.
The regulators and the uncertainty around obtaining their approval for a bank merger is another headwind. Unfortunately, bank supervisors have grown more hostile to takeovers when the banks in question are already large. The OCC released a proposal last month that would eliminate expedited review, raising the uncertainty level around the approval process as commenters have complained.
Negative AOCI and the bank regulators aside, the improving prospect for rate cuts and a benign economic outcome this year is at least encouraging conversations around M&A, and that is a good thing. Maybe bankers are holding off and waiting for a change in the White House next fall, but according to the chairman and CEO of a regional bank in the southeast.
“I think that the politics is a piece of that. I think some clarity from the regulatory bodies on what they're looking for and some speed to get approval would be helpful…AOCI is still a question., but I think a lot of people are talking. There's a lot of discussion going on. There's a lot of desire to continue to get bigger. There's a lot of -- there's a benefit from a scale perspective. Scale still pays.”
More merger conversations are taking place lately, according to the president and CEO of a bank in the Midwest,
“I think there's a lot more conversations.”
The problem with bank accounting from the user’s perspective is that it does not provide enough detail to appreciate the nuances in a company’s financial position, especially when it involves a financial institution. Banks are complicated, comprised of complex financial instruments, exposed to complex risk, that may seem benign at first glance but may not be as easy to understand when a closer look is taken. It all depends on perspective and detail. A bank might seem very liquid on paper, the way SVB seemed before it failed, but more detail could show that its deposit funding that seemed so stable was in fact flighty, its risk governance was poor, and its sizeable liquidity portfolio was so underwater it was an anchor of illiquidity. And even when all the details are provided and known, management can still miss what lies in plain sight.

Different types of bonds and loans all lumped together in broad categories of financial assets and liabilities present one picture to investors. But with more detail and a closer glance that picture can change. Thus, banks report one number for their CMOs, which might include “normal” CMOs such as PACs, front-sequential bonds, IOs, and POs, but could also include “agents of mass destruction” type inverse-floaters. They also report one number for brokered CDs, but that number could include some with death puts. And total assets include some that are carried at historical cost, and some carried at fair value.
Financial statements present a snapshot papering over a lot of these differences. If you look at it one way, you see a pretty picture. But if you look at it the other way, the picture may not be as pretty.
The Bank Treasury Newsletter is an independent publication that welcomes comments, suggestions, and constructive criticisms from our readers in lieu of payment. Please refer this letter to members of your staff or your peers who would benefit from receiving it, and if you haven’t yet, subscribe here.
Copyright 2024, The Bank Treasury Newsletter, All Rights Reserved.
Ethan M. Heisler, CFA
Editor-in-Chief