

BANK TREASURERS DON’T CARRY CASH
A worse-than-expected nonfarm payrolls (NFP) print at the beginning of this month set off a short-lived market panic in the equity and bond markets that continued into the following week. Traders freaked out, worried that the U.S. economy was suddenly falling off a cliff and that the Fed might have to move more aggressively to cut interest rates than the market had expected. Before the NFP print on Friday, August 2, the Chicago Mercantile Exchange (CME)’s FedWatch monitor calculated the odds of a 50-basis point rate cut at the Federal Open Market Committee (FOMC) meeting next month at about 10%. Those odds shot up to 85% when bank treasurers returned after the weekend on August 5.
In the immediate aftermath of the NFP print, after equity and bond market traders regained their senses that the U.S. economy was not on the verge of falling off a cliff necessitating massive rate cuts by the Fed to save it, the CME still put the odds of a 25-basis point cut next month at 60-80% and pegged the chances of a 50-basis point cut at 20%-40%. Then, the minutes from the July 31st Federal Open Market Committee (FOMC) meeting were released, asserting that members were “satisfied” that inflation was returning to target. The minutes raised the odds for a 25-basis point cut next month, and the CME FedWatch monitor still calculates the odds of a 50-basis point cut at about 20%-25%. Chair Powell’s speech at Jackson Hole, Wyoming, on August 23 practically confirmed that there will be a cut in September, which most bank treasurers believe will only be 25 basis points.
While the panic caused no lasting damage to markets, it did expose a significant vulnerability to a market run in the currency swaps market, especially to swaps involving borrowing the Japanese Yen. The Japanese Yen-Mexican Peso swap became very popular last year. According to recent research by the Bank for International Settlements (BIS), hedge funds increased their exposure to cross-border swaps by more than $1 trillion going into 2024, focused on Latin American countries. Since the beginning of 2024, however, Japanese Yen fundamentals strengthened while Mexican Peso and Dollar fundamentals weakened. In March and again last month, the Bank of Japan (BOJ) raised rates for the first time in 30 years while the Fed and other central banks, including the Bank of Mexico (BOM), cut or are in the case of the Fed on the verge of cutting them.
Bank treasurers and the rest of the fixed-income market generally believe that rate cuts will correct the Treasury yield curve, which has been inverted for almost two years, the theory being that the front end of the yield curve will fall, and the back end of the curve will stay anchored. Indeed, the well-known 2-year-10-year Treasury spread, currently at negative 15 basis points, which has been in negative territory since November 2022, was already climbing since the beginning of the summer from a negative spread back to positive sloping territory in anticipation of rate cuts. However, the spread between the 3-month Treasury Bill and the 5-year Treasury Note, particularly relevant to bank treasury for much of the benchmarking of loan and deposit pricing, has also been inverted since November 2022. According to FRED data, the 3-month-5-year spread averaged minus 126 basis points in July, but over the first three weeks of this month, the inversion averaged 159 basis points.
Much of the rationale for a rate cut in September and possibly two more before the end of the year in November and December, given the prevailing inflation rate, is that at a range of 5.25%-5.50%, the Fed funds rate is too restrictive. Real Fed funds, estimated by subtracting the 2.9% July Consumer Price Index (CPI) annual rate from the 5.33% nominal effective Fed funds rate, is 2.43%. Real Fed funds are up nearly 6 points since the Fed began to raise rates in March 2022. The sharp increase exceeds any other tightening period in modern times. Yet, despite the Fed’s severely hawkish turn, economic statistics summarized in the latest Fed minutes still paint a picture of a healthy, growing economy.
Bank supervisors are taking aim at brokered deposits with a new proposal that would tighten exceptions for treating deposits originated through third parties as brokered. Under Section 29 of the Federal Deposit Insurance (FDI) Act, banks that do not meet the well-capitalized standard face restrictions from access to brokered deposits. The timing of the new proposal reflects the FDIC’s intention to address vulnerabilities in the financial system. The proposal responds to two high-profile Fintech bankruptcies, Synapse and Voyager, which in turn jeopardized the economic health of banks that were using their services to originate deposits, and to the failures of Silicon Valley Bank (SVB), Signature Bank, New York (SBNY), and First Republic Bank, even though none of these institutions would have been in-scope for the proposed restrictions because all of them were well-capitalized banks. According to a 2019 study by the Fed, less than half of 1% of all commercial banks do not meet the standard for well-capitalized.

The Bank Treasury Newsletter August 2024
Dear Bank Treasury Subscribers,

We know you are all busy with a bunch of operational issues affecting your Treasury department that take you away from your day job, involving setting deposit rates, overseeing the investment portfolio, balance sheet liquidity, and asset liability management. You know, the stuff you thought you got hired to do. We know you are busy. But please step back for a minute (in the modern everyday sense of the word "minute"), and let's look at a particular variety of the Yen carry trade, where you borrow Yen to invest in Mexican pesos. Come on; discussing something that has nothing to do with your day-to-day will be fun.
Remember, as we go through this discussion, that market panics do not make sense. We discussed this last month. Accidents waiting to happen still happen for complex reasons, are not always transparent and are subject to change. The thing is, even now that the mini Yen panic has subsided and the price of Yens and Pesos are back to where they were before the NFP on August 2, bank treasurers should be rightly worried that the risks for some massive currency unwind Armeggedon still lurks somewhere in the bank world.
But let's dive in. You are the trader and make the call. Here is the trade: the Japanese 10-year bond yields less than 1%, and the Mexican 10-year bond yields more than 10%. So, you have a spread through which you can drive a proverbial truck. What do you think?
Trade Fundamentals
Economic fundamentals in Japan are challenging, but in Mexico, they are promising. For example, 31% of Japan's population is over 65 years old, compared to 8% of Mexico's population. Japan's debt is over 260% of its GDP, compared to Mexico's, which is less than 50%.
The story gets better. Japan has struggled with a deflationary economy since the mid-1990s, with an annual inflation rate in single basis points. The BOJ put a Negative Interest Rate Policy (NIRP) in place in 2016 to try to nudge inflation but to no avail. Mexico, by contrast, has had a history of double-digit inflation, and even though the BOM was able to rein in the country's inflation rate during the last twenty years, let's be honest here, at 4-5%, Mexico's inflation average is still not close to the Fed's 2% target if that matters any. Suffice it to say, looking at these few facts; it should not take a PhD in economics to figure out that trading Yen into Peso could generate some big bucks for someone's profit and loss.
So, if you were an enterprising trader with some capital to trade, and you did not work at a bank where highly speculative trading is generally frowned on if not a violation of some Volcker proprietary trading rule, you would borrow Japanese Yen, convert the proceeds into Mexican pesos, and use the converted proceeds to buy the 10-year Peso bond. You could also put on the same arbitrage in the futures market, which will be cheaper and less complicated, but to each their own.
The trade seems like a sure thing on paper, a classic mispricing based on the credit fundamentals. If fundamentals matter, you would think that Japanese bond yields should remain low and Peso bond yields should stay high, and that when it comes time to swap Pesos back into Yen to repay the banks that lent the Yen to you in the first place, that the Yen will not be more expensive to buy back than it was to borrow. Given what you know so far, that will not happen. At least you would not think that interest rates in Japan will likely increase and fall in Mexico.
And if you are a hedge fund, you will probably want to juice it up with some leverage thrown into the mix, too. According to data from the BIS and the Office of Financial Research, hedge funds might have poured more than $1 trillion into cross-currency trades going into 2024 with secured bank loans (Figure 1), including repo and prime brokerage. But, er, hold on. Before you go ahead and put this trade on, you need to know a few more things about Mexico and Japan.

Figure 1: Secured Cross-Currency Bank Loans to Hedge Funds
So, do you know that business with Mexico's debt-to-GDP ratio is the one that looks so much better than Japan's? Well, just keep in mind that the country's annual fiscal deficit is growing like a weed (no pun intended), and economists project that at the rate the government goes, its national debt could exceed GDP before the end of the decade. The country just elected a new administration facing several other urgent priorities, such as political assassination and violence, that may require its attention.
Also, poverty is a big problem in Mexico, as 43.5% of the population lives in it. In the U.S., the poverty rate is not low, but at 11%, it is better than Mexico's poverty rate. Japan, the fourth largest economy in the world, has a poverty rate of 15%. Put all together, one might see why, in early March, after the election of a new president, the Peso had a brief panic attack and fell precipitously before recovering.
Then there is inflation, which generally is negative for currency values, except when dealing with Japan's deflationary economy. After trying everything it could to perk up the country's inflation rate and leaving monetary policy in an accommodative mode for decades, the BOJ, like the Fed and other central banks worldwide, suddenly found itself amid an inflationary surge in the aftermath of Covid.
In 2021, the annual inflation rate in Japan was minus 0.23%. In 2022, it jumped to 2.5% and hit 3.3% in 2023 before moderating this year. Japan's CPI last month was 2.8%. In Mexico, CPI was 4.7% in 2023 and surged to 5.6% last month, its highest reading in more than a year, as prices for fruit and vegetable increased. If this were happening now in the U.S., inflation readings like this would seriously shut down hopes for rate cuts before the end of the year, three, two, or maybe even one of them. But this is Mexico, so this month, the BOM looked through what it considered just noise and cut its benchmark overnight rate by 25 basis points to 10.75%.
Japan Turns Hawkish
It is safe to say that carry trade enthusiasts did not expect the BOJ to turn hawk this year and the BOM to turn dove. Last March, the BOJ decided it could wait no longer and had to tackle inflation immediately. So, it officially ended its NIRP, launched its version of QT, and raised its overnight lending rate by ten whole basis points to 10 basis points.
Yes, the OMG drama moment here looks pretty subtle, especially for bank treasurers who tend to think about central bank rate decisions in units of 25 basis points. But this is Japan, where ten basis points are high for a rate hike, much less for an overnight interest rate. The 10-year bond yield has never been higher than 2% since 1998; most of the time, it has been at 0%, and just recently, it has gotten as high as 1%. But rates have been higher in Japan. In September 1990, the Japanese 10-year bond yield peaked at 8.0%, but that was when the U.S. 10-year bond yield was closer to 9.0%.
And on July 31, the BOJ hiked its overnight rate by another 15 basis points, suggesting that its accommodative days were over. Never mind that the BOJ’s monetary policy is still accommodative. However, as with all central banks, there are lines between the lines that bank treasurers know to read, and they will tell you that it is not always the specific action taken that matters as much as what central bankers say about the action. Thus, the BOJ’s statement on July 31 sounded kind of hawkish, and was promising more hikes to come,
"Given that real interest rates are at significantly low levels if the outlook for economic activity and prices presented in the July Outlook Report are realized, the Bank will accordingly continue to raise the policy interest rate and adjust the degree of monetary accommodation."

The BOJ’s rate hike on July 31st also fit a narrative in bank treasury circles about the weakening trend in the U.S. dollar, which is not a trend that traders into the carry-trade like to hear, who know that whence goes the dollar goes the Peso. If your average hedge fund trader levered up going into the BOJ’s announcement, they must have already been pretty jittery and thinking about unwinding. As the Fed noted in its minutes this month, hedge funds have a lot of money on the table,
“Leverage at hedge funds was at its highest recorded level based on data since 2013, partly due to the prevalence of the cash–futures basis trade.”
Olympic Central Banker Synchronized Cutting
Who could blame them for being nervous with more than $1 trillion in cross-border borrowings from banks, given how the other central banks were all talking down the value of their currencies with all of their rate cut talk and speaking the same way simultaneously? Not that anyone in the fixed income business for longer than a rate cycle does not understand what the central bank giveth with rate hikes it will eventually taketh with rate cuts. But still, the month of July leading up to the NFP print on August 2 brought a lot of disappointing news.
First came the ECB on July 18, when it decided to hold off on a second rate cut, following its decision in June to be the first central bank to cut rates by 25 basis points. Further reductions in rates may be in the offing, but for now, like all central banks, and as Chair Christine Lagarde told reporters at her press conference following the meeting, the ECB will remain data-dependent,
“We were determined to be data dependent to decide meeting by meeting and not to have any predetermined rate path… We must look at all components of data, all measurements, all indicators that will be coming in, in the next weeks and months. So, this is going to be a process…Domestic price pressures are still high, services inflation is elevated, and headline inflation is likely to remain above the target well into next year.”
Bank of China surprised the market and saddened its Yuan enthusiasts with a ten basis point cut on July 22. Then came Canada, which cut its rate on July 24 for the second time this year. On July 31, when the BOJ announced a 15 basis point rate hike, the Bank of England (BOE) cut its bank lending rate by 25 basis points, from its 16-year high to a still very high and restrictive 5.0%. Inflation is tamer in the U.K. than in Japan, but when it cut rates, like the BOM, it saw through month-to-month noise and thus ignored that inflation in the U.K. ticked up a smidgen in July, to 2.2%.
Time To Cut
Which brings us to the Fed. As bank treasurers know, the Fed announced on July 31 that it was leaving its target Fed funds rate unchanged at 5.25%-5.50%. The Fed is now the only major central bank holding out on a rate cut other than the BOJ, which is going the opposite way.
Fourteen months have passed since the Fed’s last rate hike, which is a long time in Fed rate cycles for the Fed to hold off on cutting its benchmark rate after a period of tightening. Indeed, the ongoing pause is the longest it has gone since the century began. After raising rates in June 2006, the Fed waited until September 2007 to start cutting again. After it finished raising them again in December 2018, only seven months had passed before its first cut came in July 2019.
However, the most extended pause by the Fed after a tightening cycle was between January 1995 and November 1998. Much like today, the economic landscape featured steady growth, with the nominal Fed funds rate averaging 5%-6% and CPI trending between 2%-3%. Thus, the real Fed funds rate was a steady 3%, a number to remember when looking at the graph in Figure 2, which estimates a real Fed funds rate as the difference between monthly CPI and the monthly average nominal Fed funds rate.

Figure 2: Effective Fed Funds Rate Minus Median Consumer Price Index
Based on the Fed’s H.8 data (see Slide 2 in this month’s chart deck), the average monthly loan growth during the Fed’s most extended pause in the 1990s was 9%. Loan growth since the Fed began its present pause has been 2%. Whether the economy is solid or on the verge of a mild recession, regardless of whether one views a 3% real Fed funds rate as restrictive, the simple truth is that borrowers are not willing to borrow at current levels.
Considering the stress on commercial real estate developers and building owners who are mortgaged and worrying about being able to pay a higher rate when it comes time to refinance, bank treasurers can make a straightforward case of why the Fed funds rate is restrictive and needs to be cut. Plus, it is not the absolute level of the rate that matters as much as the change in that rate, and going from minus 7% to plus 3% in two years, in real terms, is shocking. Indeed, from a historical standpoint, the real interest rate has not moved so far and so fast, pretty much ever.
Regardless, Chair Powell could not have made carry traders very happy when he spoke at his press conference after the meeting. Asked about the chances of a rate cut in September, he told reporters that,
“The question will be whether the totality of the data, the evolving outlook and the balance of risks are consistent with rising confidence on inflation and maintaining a solid labor market.”
Which is not new news to bank treasurers, but then he added that,
“If that test is met, a reduction in our policy rate could be on the table for as soon as the next meeting in September.”
At Jackson Hole this month, he all but confirmed that at least one rate cut is coming as soon as next month when he said,
“After a pause earlier this year, progress toward our 2 percent objective has resumed. My confidence has grown that inflation is on a sustainable path back to 2 percent.”

What’s 60,000 Jobs Versus 161 Million?
However, another view says that the economy is strong and that if rate cuts are coming, there will not be many. At least that was the assumption in bank treasury circles that the U.S. economy was in good shape until the morning of August 2, when the Bureau of Labor surprised hedge funds and bank treasurers with its “big miss” report that the U.S. economy only produced 114,000 new jobs last month when Street economists were expecting 175,000.
Despite a historically significant spike in real rates, long since consumers spent their last Covid stimulus check, consumers are still spending at the cash register. Retail sales were up 1% in July. Tell that to the restrictive rate camp. Maybe consumers are spending more cautiously, but they are still spending
But the headlines on August 2 were about the end of the world and the near certainty that the Fed was not just cutting in September; it was going to cut big-time, at least by 50 basis points, and some market commentators were pushing 75 basis points in the wake of the “number.” Out of their minds, traders forgot about the soft landing narrative and braced for the hard one.
At that moment, there was no point trying to explain to a stampede of hedge fund carry traders scared and wanting out that there are 161 million persons employed in the U.S., against which the difference of 60,000 jobs is not even a basis point. There was no point at that moment in trying to rationalize with them that the Fed already knew what the NFP number would be. They would have cared less that despite the Fed’s shock and awe rate hikes, jobs are still growing, that even at an elevated 4.3%, the employment picture in the U.S. has not looked this good in years (Figure 3), or that when the Fed raised rates in previous cycles, the unemployment rate was over 5%. At that moment and in the first couple of days after the NFP print, you might as well have been talking to a wall.
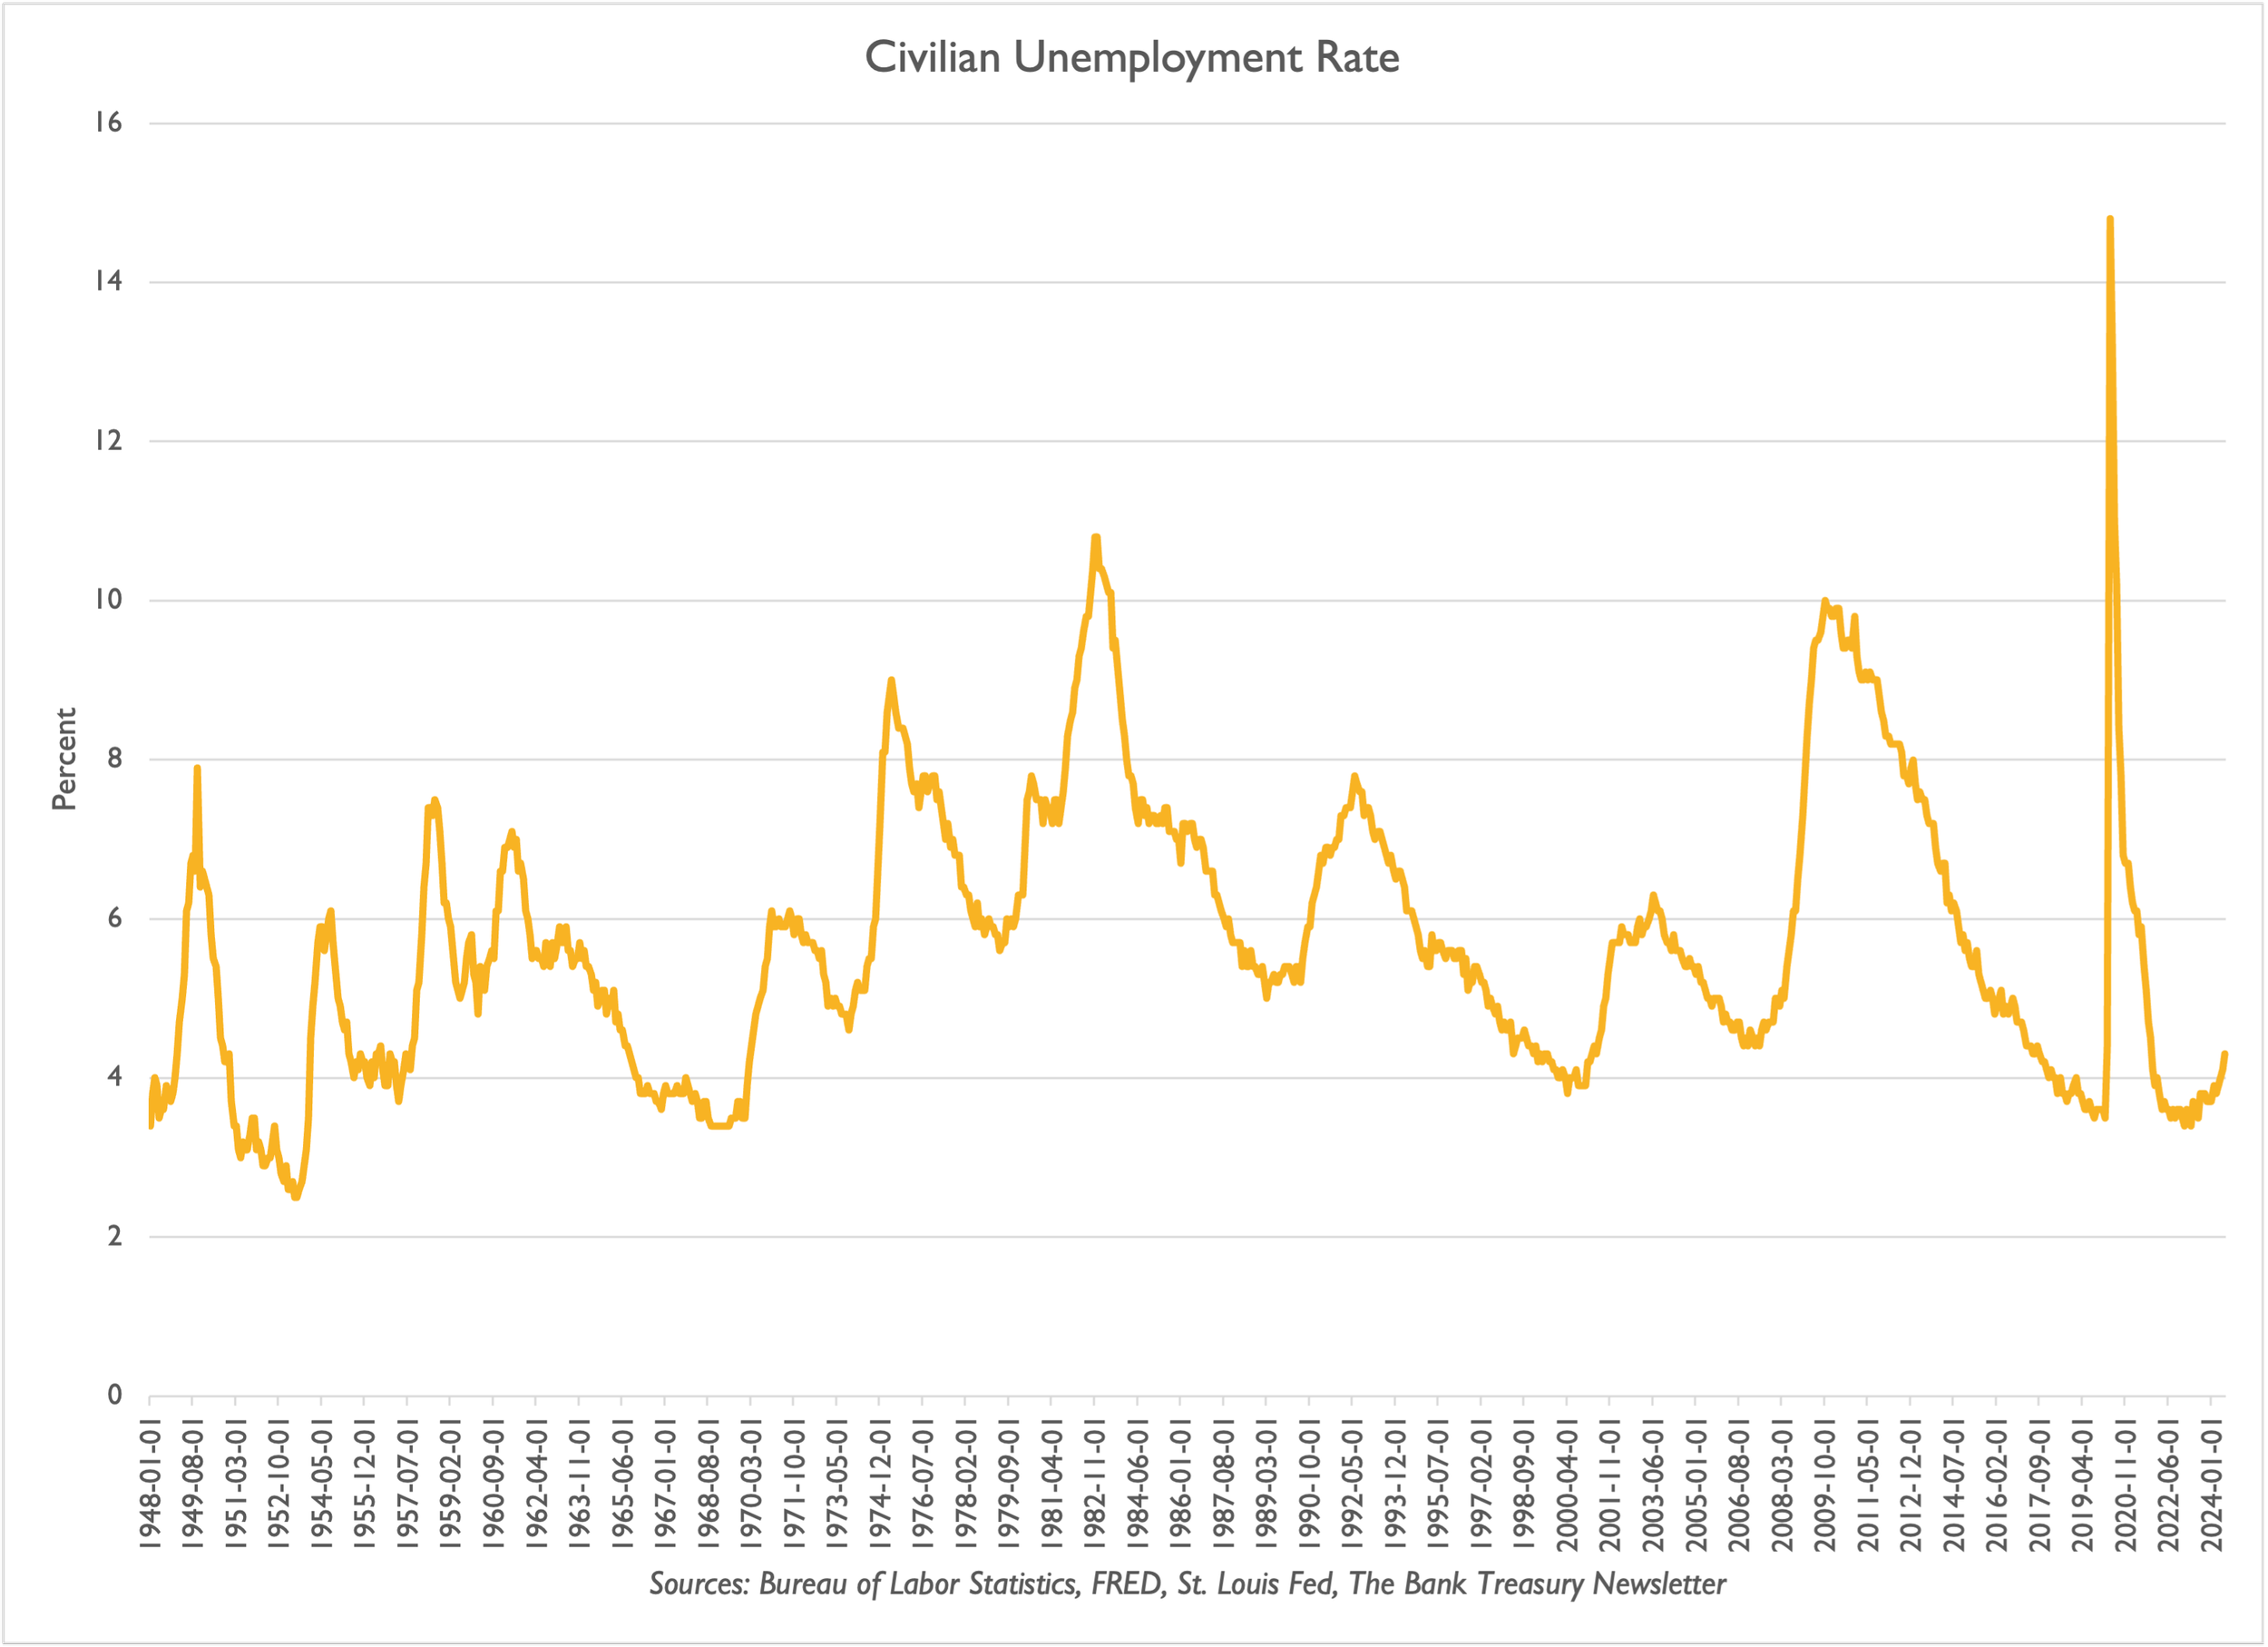
Figure 3: Civilian Unemployment Rate
Picking Up The Pieces
Generally, if you are going to have a market panic, it is good to panic before a weekend. Think of the weekend as a cooling-off period. If the FedWire does move to 22X7 and maybe the rest of the capital markets go along with that, one day, there will no longer be a weekend timeout. And, considering that Signature Bank failed over the weekend, maybe long weekends are a thing of the past in the bank world.
Regardless, the weekend did nothing to cool off the unwind stampede convinced that the Fed waited too long to cut rates and now will need to cut as hard as it had hiked to avoid disaster and that the Yen was a buy, not a sell. The value of the carry trade fell, as traced in the Yen/Peso futures contract historical price data shown in Figure 4.

Figure 4: Yen-Peso Currency Swap Futures Contract

But then market participants came to their senses as the month progressed, helped by a string of economic data this month that seemed to refute the risk of an imminent recession and sharp cutting cycle. First came a benign Job Openings and Labor Turnover Survey. Then, the CPI and PPI numbers that came out were generally benign, with inflation maybe even easing. Finally, retail sales came out solid. Something for everyone: believers in a soft landing and rate cuts, had something to cheer about. As the chairman, president, and CEO of one of the global banks told reporters the week following the NFP, market overreaction is nothing new,
"Markets fluctuate. I think people overreact a little bit to the daily fluctuation of the market. And sometimes it's for good reasons. Sometimes it's for no reason."
As Yen-Peso traders were just calming down in the week after the NFP print, the senior executive at another of the global U.S. banks told reporters he was optimistic about the economy,
"My view is that the best chance, as we look forward, is the economy will chug along and we probably won't see a recession. But the possibility is not zero. It's never zero. I'd say it's slightly elevated from what we normally expect.”

Yen-Peso: Just Another Type of Repo
The market may have rebounded, and the great unwind Armageddon may have passed, but the dangers for bank treasury remain. The yen carry traders have gotten a reprieve, and BOJ officials appear to be downplaying the BOJ's hawkish turn. Still, inflation in Japan is higher than anyone can remember in decades. Economists there may need to adjust to a new world where inflation is the new normal in Japan instead of deflation. Instead of interest rates prevailing at levels that pay Japanese savers to spend, they hold at levels that pay them to save.
The NFP market panic and the Yen-Peso unwind scare this month exposed a vulnerability that bank treasurers know all about from the repo market (see this link). All currency swaps, including the Yen-Peso swap, are ultimately a reverse repo, except with currency instead of U.S. Treasury or Agency securities as collateral. The swap is basically selling Yen today to buy it back cheaper tomorrow and borrowing the Yen in the meantime to settle the short. That is what a reverse repo is all about.
If the world has changed and Japan is no longer the land of deflation, then the value of that Yen collateral that swap traders have been using to finance their investment in Peso bonds will be appreciate. That could be a losing trade. According to research this year by the BIS, emerging market swaps grew substantially through the end of last year. A run out of this trade might only be a matter of time.
And with runs, the thing to remember is to be first out the door. All roads lead back to the Fed because, as 2022 research by the BIS suggested, payment obligations connected to currency swaps could total nearly $100 trillion, of which the majority involve the U.S. dollar on one side of the swap. A few cuts may not matter, but if the U.S. faces a potential major recession around the corner, markets could be staring at a lot of pain.
Cutting or Easing? Words Matter
But there is a big difference between cutting and easing. Cutting is just another word for adjusting, meaning that bank treasurers would expect to see the Fed reduce its target range on Fed funds by 100-150 or so basis points. Easing is what the Fed would do to address a recession. If the economy were about to take a turn for the worst, as panicky market participants worried was the case in the immediate aftermath of the NFP print, bank treasurers would be looking at cuts totaling 200 to 300 basis points. If it gets bad, the Fed could revisit the 0-lower bound, creating losses that might dwarf the losses sustained in the structured product market during the GFC.
Inverted Yield Curve Stays Inverted
Whether the Fed is cutting or easing will make a big difference to bank treasurers who believe the yield curve will normalize. While the spread between the 2-year Treasury and 10-year Treasury usually grabs all the headlines in the financial press, bank treasurers tend to focus on the front end of the yield curve, looking out to its belly. All banks are different, but many bank treasurers like to focus on the spread between the 3-month Treasury Bill and the 5-year Treasury note.
The negative spread between the 3-month and the 5-year is now in its 21st month, the longest stretch in modern history where this part of the Treasury yield curve was inverted. In the early 1980s, the curve had been even more inverted than it is today, but it has never persistently stayed inverted for as long as it is today. Bank treasurers believe, in line with consensus, that when the Fed starts cutting the target range on the Fed funds rate, the front end of the yield curve will fall, and the back end will stay in place, turning an inverted yield curve into a normal, positive-sloping curve.
One problem with this theory is that, measured by the negative 150 basis points that today separate the yield between the 3-month and 5-year Treasury, whether one calls it cutting or easing, the Fed will need to chop more than 150 basis points from the front-end with the belly of the curve to get anywhere near normal territory. And, if we are talking about 200 or maybe 300 basis points of cutting, that starts to look more like easing, which is generally a policy action associated with recessions, not economies like the U.S. has today, with low unemployment and decent but not spectacular growth.
And if investors who have already demonstrated a propensity to panic expect to get a standard yield curve out of the Fed's imminent rate cutting, they might reasonably extend duration in their portfolios to protect returns, and the yield curve might remain inverted or get even more inverted. Nervous traders could panic that what starts out as cutting will get out of control and turn into easing. As shown in Figure 5, around the beginning of the summer when rate cuts began to look more likely before the end of the year the curve's inversion increased.

Figure 5: 3-Month-5-Year Spread
Defining and Restricting Brokered Deposits
If the currency markets are vulnerable to a liquidity crisis, bank regulators may be wasting time on some of the preventive measures they have chosen to pursue. For example, last month, the FDIC proposed a new rule redefining a brokered deposit, which caused quite a stir in bank treasury circles. But once you get past the headlines, it is hard to understand precisely what hole the FDIC is trying to plug that should worry anyone.
A brokered deposit is “any deposit that is obtained, directly or indirectly, from or through the mediation or assistance of a deposit broker.” A brokered deposit is any deposit that comes to a bank through a third party and turns on the definition of a deposit broker. But, very significantly, Section 29 of the FDIC Act only restricts banks that do not meet the well-capitalized threshold from access to the brokered deposit market. It says nothing specifically about banks that meet the standard.
To be well-capitalized, a bank must maintain a total risk-based capital ratio over 10.0%, a tier 1 risk-based capital ratio over 8.0, a common equity tier 1 capital ratio over 6.5%, and a tier 1 leverage ratio over 5.0%. And, if that is not daunting enough, there are more requirements insured depository institutions (IDIs) need to meet, as IDIs cannot be,
“…subject to any action issued by the FDIC under Section 8 of the (Federal Deposit Insurance) FDI Act, the International Lending Supervision Act of 1983, the Home Owners’ Loan Act, or Section 38 of the FDI Act, or any regulations thereunder. A bank subsidiary of a covered bank holding company will be deemed well capitalized if it meets the above criteria and has a supplementary leverage ratio over 6.0%.”
But here is the thing. More than 99% of the banks in the U.S. are well-capitalized, which means that with 4,568 chartered banks, the FDIC’s proposed regulation would only apply to a few dozen banks at most. According to an analysis by the Federal Reserve in 2020, less than half of 1% of banks are not well-capitalized.
Bank supervisors do not regularly make public the number and percentage of banks that are not well-capitalized. However, surveying call reports, less than a handful of tiny banks would not meet the standard as of June 30, 2024. The FDIC reported last quarter that the number of problem banks has risen since the beginning of the year from 43 to 63, which only confirms restrictions on brokered deposits is not a major concern for bank treasurers.
A bank’s FDIC insurance assessment rate, would be impacted by the FDIC’s proposed rule, but in a limited way for the average bank as brokered deposits are one factor among several, including a bank’s capital, profits, credit risk, loan mix, and interest rate risk that can raise it. For example, to calculate a brokered deposit adjustment to its assessment, a bank with less than $10 billion in total assets would multiply the ratio of its brokered deposits less its reciprocal deposits that exceeds 10% of total assets by a factor of 0.264. However, for perspective, the factor for its tier 1 leverage ratio is five times that.
The other way it might affect a bank’s access to the capital markets is that the traditional calculation of the core deposit ratio that credit analysts use to analyze a bank’s financial condition excludes brokered deposits. As of June 30, 2024, 600 banks reported that their brokered deposits exceeded 10% of total assets, and the average size of the bank was $6 billion.
Ever since the early 1980s, when abuse of the brokered deposit market led to a rash of bank failures over the decade and raised significantly the resolution costs that were absorbed by the Deposit Insurance Fund (DIF), the lesson bank regulators learned is that brokered deposits are a risky source of funding for banks. The chair of the FDIC summarized the concern in his statement on July 30, explaining the objectives for the proposed amendment to Section 29,
“Section 29 is aimed at addressing longstanding concerns regarding brokered deposits. A bank’s use of brokered deposits often raises its risk profile because: (1) such deposits could facilitate a bank’s rapid growth in risky assets without adequate controls; (2) once problems arise, a problem bank could use such deposits to fund additional risky assets to attempt to “grow out” of its problems, a strategy that ultimately increases the losses to the Deposit Insurance Fund (DIF) when the institution fails; and (3) brokered and high-rate deposits are sometimes considered less stable because deposit brokers (on behalf of customers), or the customers themselves, are often drawn to high rates and prone to leave the bank quickly to obtain a better rate or if they become aware of problems at the bank. Historically, and as described in the preamble to the Proposed Rule, various studies and reports have shown that reliance on brokered deposits is associated with a higher probability of a bank’s failure and higher DIF loss rates.”
The proposal would expand the definition of a deposit broker so that a fintech company with an exclusive relationship sourcing deposit money for the bank could be defined as a deposit broker. As the chair noted in his July 30th comments about the proposal, the Voyager bankruptcy in 2022 demonstrates that a fintech’s exclusivity arrangement with a bank makes no difference in terms of the risk the activity poses for a bank’s failure,
“The crypto company Voyager was not considered a “deposit broker” -- and therefore deposits it placed in its partner bank were not considered brokered -- merely because it had an exclusive deposit placement arrangement with one bank. Such exclusive deposit placement arrangements were specifically excluded from the definition of a “deposit broker” under the 2020 Final Rule even though they plainly met the definition of deposit broker. As a result, when Voyager failed in 2022, it created the same legal, operational, and liquidity risks for its partner bank as if it had been classified as a deposit broker… including, but not limited to: (i) legal risk related to customers’ lack of access to their funds for several weeks; (ii) earnings risk related to legal fees and increases in interest expense as a result of the loss of the low-cost Voyager deposits; and (iii) liquidity risks related the need to replace the Voyager deposits once the bankruptcy court cleared release of the funds to end users.”
The hole in the bank supervisory fabric that the FDIC wants to fill with this amendment, which may involve at most 63 banks and indirectly about 600 banks, was that,
“…less than well-capitalized banks may seek these exclusive deposit placement arrangements as their condition is deteriorating without being subject to the limitations on brokered deposits, even though the risk is the same.”
Who could disagree with his objective? But last year's financial crisis had nothing to do with brokered deposits. It had to do with uninsured deposits, which, for the most part, are included in the traditional calculation of core deposits. The issue beyond what or who is affected by the proposal is that the market has changed in the 40 years since regulators learned lessons about the dangers of brokered deposits. More than rules need updating. As Travis Hill, the FDIC's Vice-Chair, said last month,
“In the 1980s, the term “brokered deposit” was commonly understood to refer to a specific market in which third-party brokers gathered and pooled funds and placed them into “brokered” certificates of deposit (CDs) issued by banks.63 At the time, Congress could use a broad definition of “deposit broker,” and could broadly exclude those whose primary purpose was not the placement of deposits,64 because “deposit brokers” represented a well-understood universe, and few others were “engaged in the business of placing and facilitating the placement of deposits” at the time. Most deposits came into a bank when customers walked into a local branch. However, since then, the internet, smartphones, and other innovations have revolutionized how banks interact with customers, with many types of deposit arrangements now involving intermediaries.”
Brokered deposits are a source of liquidity, and as Vice-Chair Travis Hill noted later in the same speech, the regulatory push on the banking industry is to encourage banks in need of liquidity to go to the Fed’s discount window for a loan. Regulators want to encourage banks to incorporate discount window borrowing in their contingency funding plans, pushing them to preposition collateral at the discount window to use in an emergency.
But here is the problem. Whether it is the FHLBs advances, the deposits from the brokered market, or the life saver the Fed can throw from its discount window, all the funding can lead to a bad outcome for the DIF, as he added,
“Meanwhile, as discussed above, regulators have been trying to encourage more discount window borrowing for banks experiencing funding stress, but yet the FDIC may push further to prohibit the use of brokered deposits for essentially the same purpose. From a contingency funding perspective, each has tradeoffs: the discount window can provide funds faster and at unlimited volume but suffers from greater stigma. Yet both are generally high-rate liabilities for the bank and are more or less equally costly to the DIF if the bank subsequently fails – in either case, the funding generally has no franchise value and gets paid off in full upon failure.”
Window Stigma Undermines Its Contingent Funding Source Reliability
If a bank gets into trouble and needs funding, its treasurer should keep a few things in mind. Besides providing an elastic currency, one of the main reasons for the Fed is to be a lender of last resort. When things look bad, when the depositors are mobbing your teller window, when all your loans are going into default, and when no one wants to lend you anything and refuses to honor your lines of credit, there is the Fed’s window. When there is no other hope, the Fed’s discount window is supposed to be your light at the end of the tunnel.
But what does this mean? First, a bank must be viable to borrow from the Fed’s window. It could be critically undercapitalized and still get a loan, but even if a bank is well-capitalized and theoretically meets all the standards, according to a straightforward reading of Federal Reserve Regulation A, Part 201.3, paragraph b, it says very clearly that the Fed has,
“…no obligation to make advances or discounts. This section does not entitle any person or entity to obtain any credit or any increase, renewal or extension of maturity of any credit from a Federal Reserve Bank.”
Second, even if a bank could get a loan from the discount window, would it want to? As bank treasurers know, there is a stigma attached to using it. If a bank did go to the window, it could cause a run and the failure it was trying to avoid because the Fed must disclose the names of its borrowers after a period. Bank supervisors have been trying to overcome the stigma effect for decades, to no avail.
The Richmond Fed studied the problem in 2020. A Liberty Street Blog from 2015 on the history of the discount window stigma found that the problem was long-standing. Indeed, when Congress established the Fed in 1914, borrowing from the window was discouraged. Another study by the New York Fed this year even concluded that efforts to overcome the stigma may never succeed short of forcing every bank to borrow some amount from the window and regularly hold it outstanding.
Short of that, bank supervisors are pushing banks to preposition collateral at the discount window, which will not precisely overcome the stigma issue but at least might make the operational issues involved in borrowing from the window a little smoother. When SVB and SBNY failed last year, they were unprepared to borrow from the window when they needed emergency funding. Aside from the headache this is causing bank treasurers trying to juggle collateral between their FHLB and the Fed, prepositioning collateral responds to the deficiencies in their contingency funding planning.
However, Fed Governor Michelle Bowman, who has been outspoken in her criticisms of regulatory reform proposals such as the Basel 3 Endgame, was skeptical of plans to require banks to preposition collateral with the window, telling attendees at a meeting sponsored by the Kansas Bankers Association this month that the time and trouble bank supervisors have put into efforts to overcome the window stigma problem may be misplaced,
“The effectiveness of a prepositioning requirement as a solution to perceived stigma concerns remains to be seen, but one can reasonably question if compulsory prepositioning or compulsory use of the discount window would materially change market perceptions and resolve bank concerns about stigma…But if we are honest, we must recognize that our prior efforts to reduce discount window stigma, as during the Covid period, have not been durable or successful, and that perhaps resources would be better devoted to making sure the discount window is prepared to act in a timely way, rather than adding even more regulatory requirements or supervisory expectations to banks that may complicate day-to-day liquidity management, with uncertain liquidity benefits during stress.”
If bank treasurers want to learn a lesson from the bank failures last year, it is that cash is king. This strategy is not said to discount the importance of contingent funding preparation, testing backup lines of credit, or incorporating the brokered market, FHLB advances, and the Fed’s window into those plans. Today and for at least one more month, the Fed is practically paying bank treasurers to sit on reserve deposits, considering that the overnight rate at 5.4% is the highest rate paid on the risk-free yield curve. But that will not always be the case, and when one day the yield curve somehow gets back to its regular, normal slope, holding reserves will come with a cost.
But that is the price for peace of mind in these turbulent times when markets seem prone to panic over the slightest blip in a monthly NFP print. Volatile times such as these require holding a lot of cash. Liquidity is the price of safety, which is unavoidably expensive for shareholder returns.
The good thing for bank treasurers is that cash may be king, but not the physical kind, which is a noninterest-earning asset. According to the Fed’s H.4 data, and as illustrated in the last slide in this month’s chart deck, the public’s demand for physical paper money is at the lowest point since the beginning of the present century. And no wonder! It pays to save it in an overnight risk-free deposit account at the Fed and it costs something to store physical cash in a vault. Bank treasurers will also tell you that vault cash does not count as a high-quality liquid asset.
The Bank Treasury Newsletter is an independent publication that welcomes comments, suggestions, and constructive criticisms from our readers in lieu of payment. Please refer this letter to members of your staff or your peers who would benefit from receiving it, and if you haven’t yet, subscribe here.
Copyright 2024, The Bank Treasury Newsletter, All Rights Reserved.
Ethan M. Heisler, CFA
Editor-in-Chief
This Month’s Chart Deck
Anticipating that a rate-cutting cycle was coming all year, regional bank stocks climbed steadily until last month, when they began to soar. The nonfarm payroll mini-market panic on August 2 crushed bank stocks, and to date, they have only recovered half of the gains made up until the day before (Slide 1). If the Fed does as is widely expected and cuts rates next month, it will have ended one of the most prolonged pauses in Fed history following a rate hiking cycle since the 1990s. As this month's newsletter discusses, the Fed funds rate on a real basis is no higher today than it was in the 1990s or during any other period when the Fed paused after a hiking cycle. Yet loan growth has never been as slow as it is now (Slide 2).
Still focused on learning lessons from the regional bank crisis last year, the FDIC is pushing a new proposal on brokered deposits to tighten restrictions on their availability to banks under stress (see this month's newsletter). Under Section 29 of the Federal Deposit Insurance Act, banks that do not meet the well-capitalized threshold defined under Prompt Corrective Action face restrictions on access to brokered deposits. However, the number of banks that might fall into this category is a few dozen out of the 4,538 currently chartered commercial banks (Slide 3). Moreover, the number of banks that use the brokered deposit market to any significant degree to meet their funding needs is a fraction of the system (Slide 4). Many bank treasurers complain that the focus on brokered deposits is misplaced and can point to the failure of Silicon Valley Bank, Signature Bank, and First Republic as demonstrating that brokered deposits may be less risky than uninsured deposits, which have still not recovered to the level they stood at before last year's crisis (Slide 5).
While bank regulators continue to focus on the banking industry's vulnerabilities, the largest source of debt financing in the U.S. comes from nonbanks, such as hedge funds, which operate virtually unregulated. Bank loans are a minority share of nonbank funding in the U.S. capital markets compared to other markets (Slide 6).
Investors in Japanese Yen carry trade strategies took a significant hit this month (Slide 7) thanks to the coincidence of the Bank of Japan (BOJ) raising rates while other major central banks either are or will soon be cutting rates, perhaps even aggressively as was initially feared in U.S. markets after the massive miss in payrolls. Household savings rates are one factor in a country's economic growth story. While savings rates have come down since the end of the emergency Covid stimulus payments, they are still above average looking back since the Global Financial Crisis and U.S. household savings rates match or exceed the savings rates of its other major trading partners, surveying rates in Canada, France, Germany, the U.K., and Japan (Slide 8). Population growth rates are another part of the story, where they continue to fall but remain positive in the U.S., and they are well into negative territory in Japan (Slide 9).
Investors might borrow Japanese Yen to invest in U.S. dollars and Mexican pesos. Still, demand for physical currency continues to fall to the lowest level since the beginning of the century (Slide 10). A 2022 study by the Fed highlighted the consumer's shift to non-cash forms of payment, including credit cards.

Nonfarm Payrolls Crushed Bank Stocks This Month

Weakest Loan Growth During A Fed Pause

Banking Industry Has Never Been Stronger

How Big An Issue Are Brokered Deposits?

Most of the Uninsured Have Not Returned

U.S. Corporate Funding: More Bonds, Less Loans

Reversal of Fortune: Yen Versus U.S. Dollar

America’s Saving Rate Remains Elevated

Demographics Can Influence Economic Fortunes

Paper Currency Demand Hits Bottom